
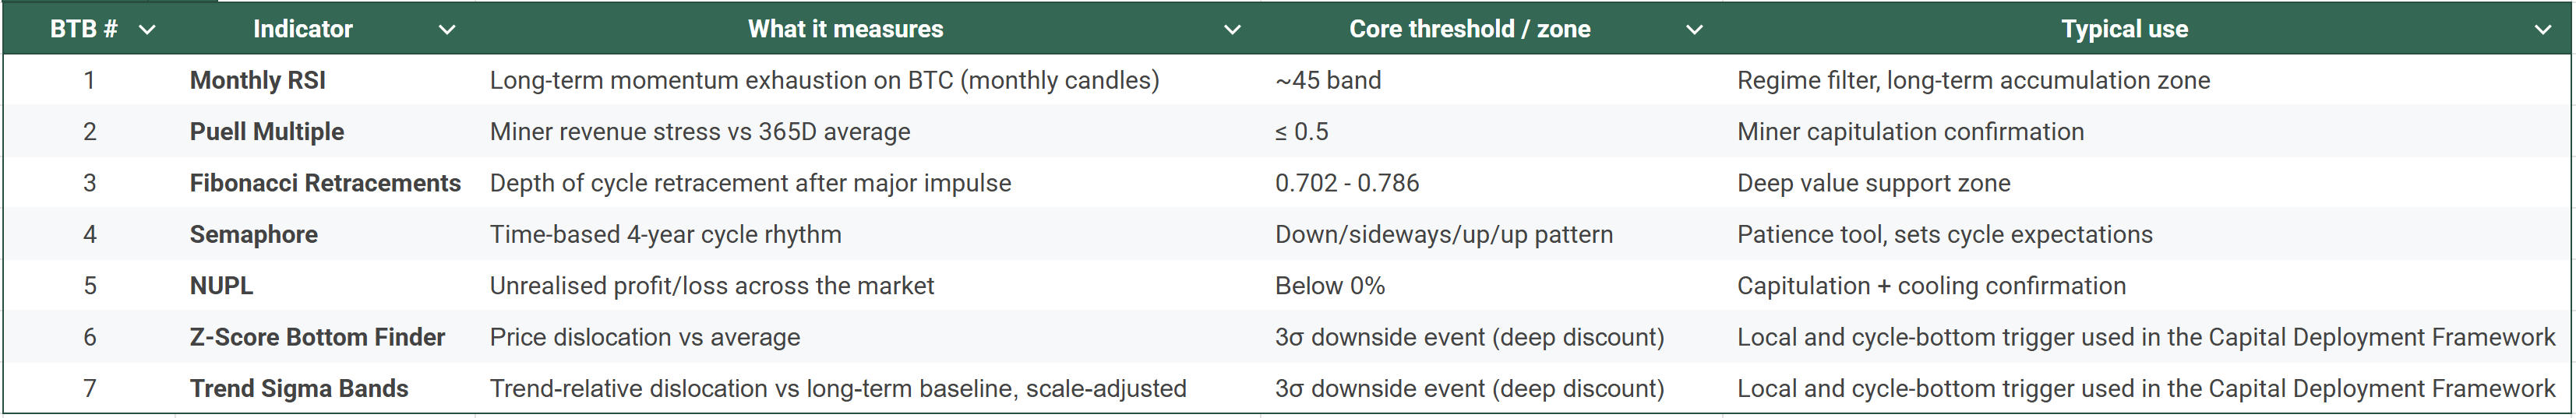
Buying the Bottom (BTB) Indicators
A reference guide to the bottoming signals and how I deploy capital

Why this exists
As markets trend down, the hardest part is not finding indicators, it’s knowing what to do with them. The point of Buying the Bottom (BTB) indicators is to identify the regime where long-term risk-reward flips back in favour of buyers.
Not the exact day of the low, not a signal to go all-in, just the zone where it starts to make sense to build positions.
These are deliberately high time frame (HTF) tools. Think cycle indicators, not trading signals. They help you stay patient through chop, avoid emotional buys, and size into weakness when everyone else is tapping out
How to use the BTB stack
My core strategy is to use the Capital Deployment Framework (CDF) to allocate the majority of my capital.
The CDF is designed for allocating during local and cycle bottoms, but it’s more tuned to local bottoms. Practically, the CDF is driven by BTB #6 (Z-Score Bottom Finder) and BTB #7 (Trend Sigma Bands), which act as my “Discount Window” triggers.
Most of the other BTB indicators are primarily cycle-bottom tools, especially BTB #1 through #5. They help identify when we’re in a broader regime where buying makes sense, even if the exact low takes time to form.
How I deploy capital:
I allocate when the CDF triggers.
I allocate an additional amount when one or more of the cycle-bottom BTB indicators trigger (for example 5% or 10% of total capital, depending on the setup).
If multiple indicators are triggering, that’s additional confluence and increases confidence that the market is in a bottoming process.
These indicators are designed to work standalone, but they are most powerful when they work together, and when they are used alongside the CDF.
Signal key used throughout:
🟢 BUY REGIME - in the historical bottom band
🔵 NO SIGNAL - not in band, stay patient
🟠 WATCH - approaching the band
Here is a summary of the indicators:
Contents Page
BTB #1 - Monthly RSI
Category: Momentum/ cycle exhaustion
Summary
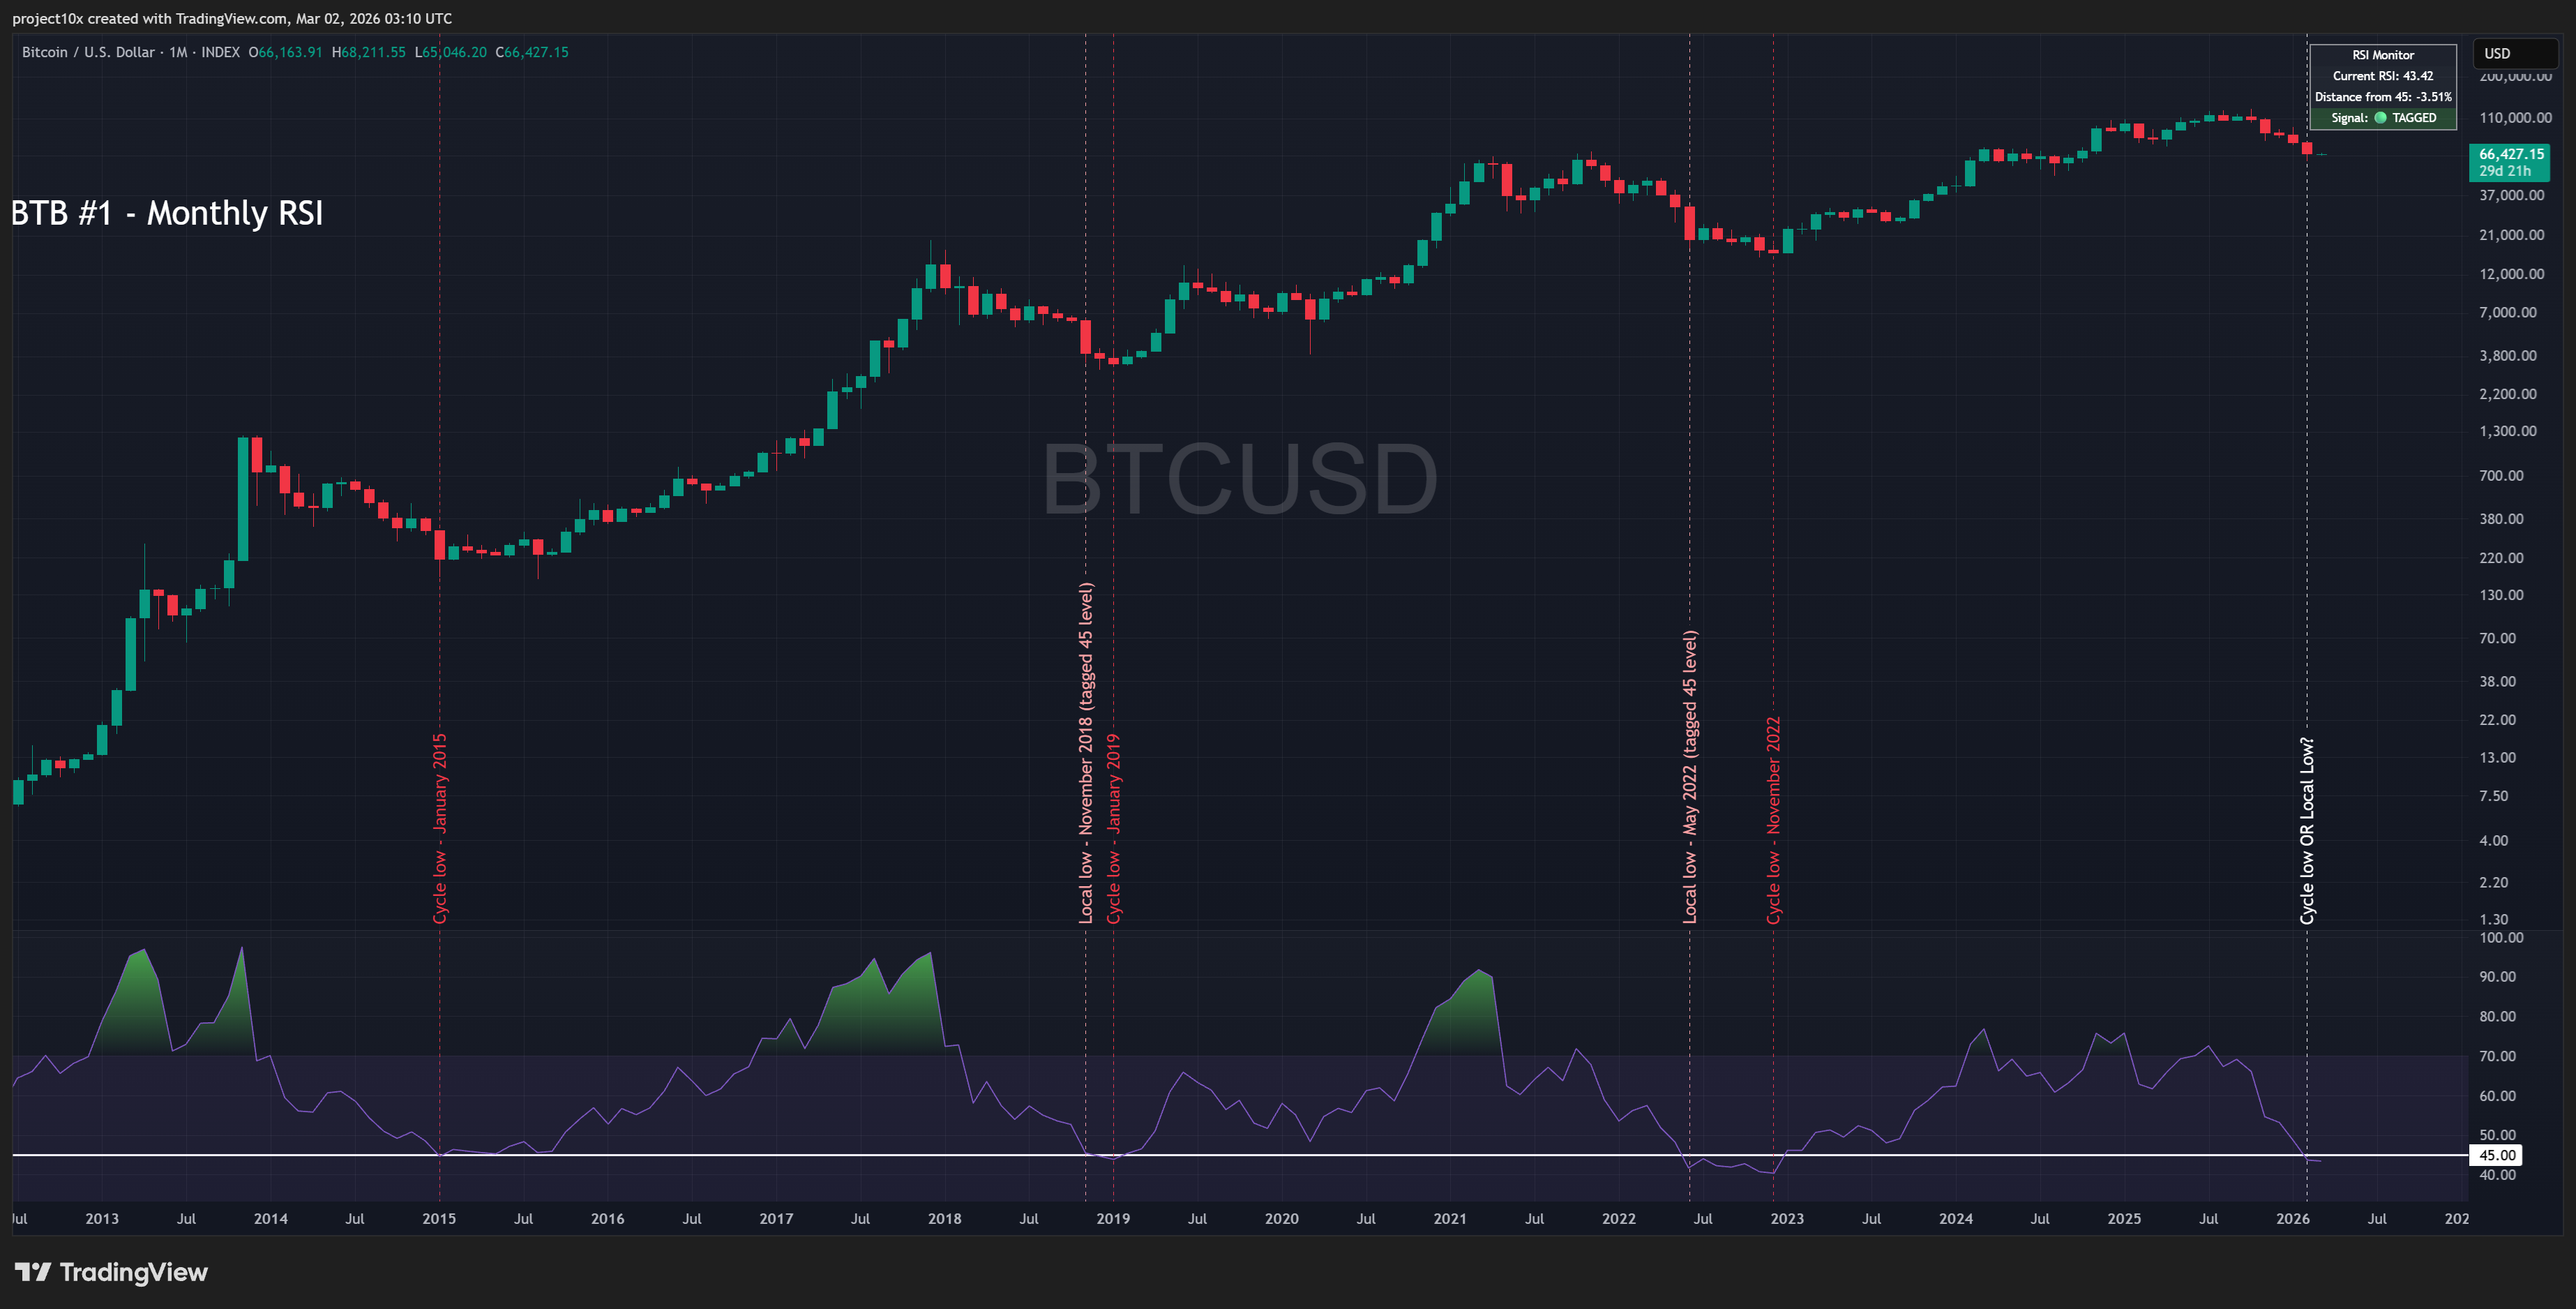
RSI on monthly ( M1) candles is a cycle gauge, not a trading trigger.
Historically, compression into the ~45 band has aligned with macro accumulation zones.
Best used as a “buying the bottom regime” flag, not a “bottom is in” call.
What it is
The Relative Strength Index (RSI) is a momentum oscillator. On a monthly chart, it filters out noise and shows whether the market is structurally overheated or exhausted. When monthly RSI compresses into the mid-40s, it has historically coincided with periods of maximum pessimism, and downside momentum being largely spent.
When it’s applicable
Best on BTC due to long history and deep liquidity.
Use on monthly (M1) timeframe.
Most valuable during sustained drawdowns and post-bubble unwind phases.
How to use it
If monthly RSI is in the ~45 band, treat it as 🟢 BUY REGIME.
Expect it to stay in-range for a while, so you could plan buys across time, not a single entry.
Pair with at least one stress or capitulation tool (Puell, NUPL, Sigma bands, Z-score bottom finder) to avoid being “early but not wrong”.
Common pitfalls
RSI can remain depressed for months, patience is part of the edge.
Not a precision bottom picker. Don’t try to snipe the low because RSI tagged 45.
Regime shifts can make historical levels less “clean”, treat 45 as a band, not a magical number.
Current state (example)
RSI has tagged the historical buy zone, signalling that it is at least a local bottom and perhaps a cycle low. In both cases, it’s a great long-term accumulation zone.
BTB #2 - Puell Multiple
Category: Miner stress/ systemic sell pressure
Summary
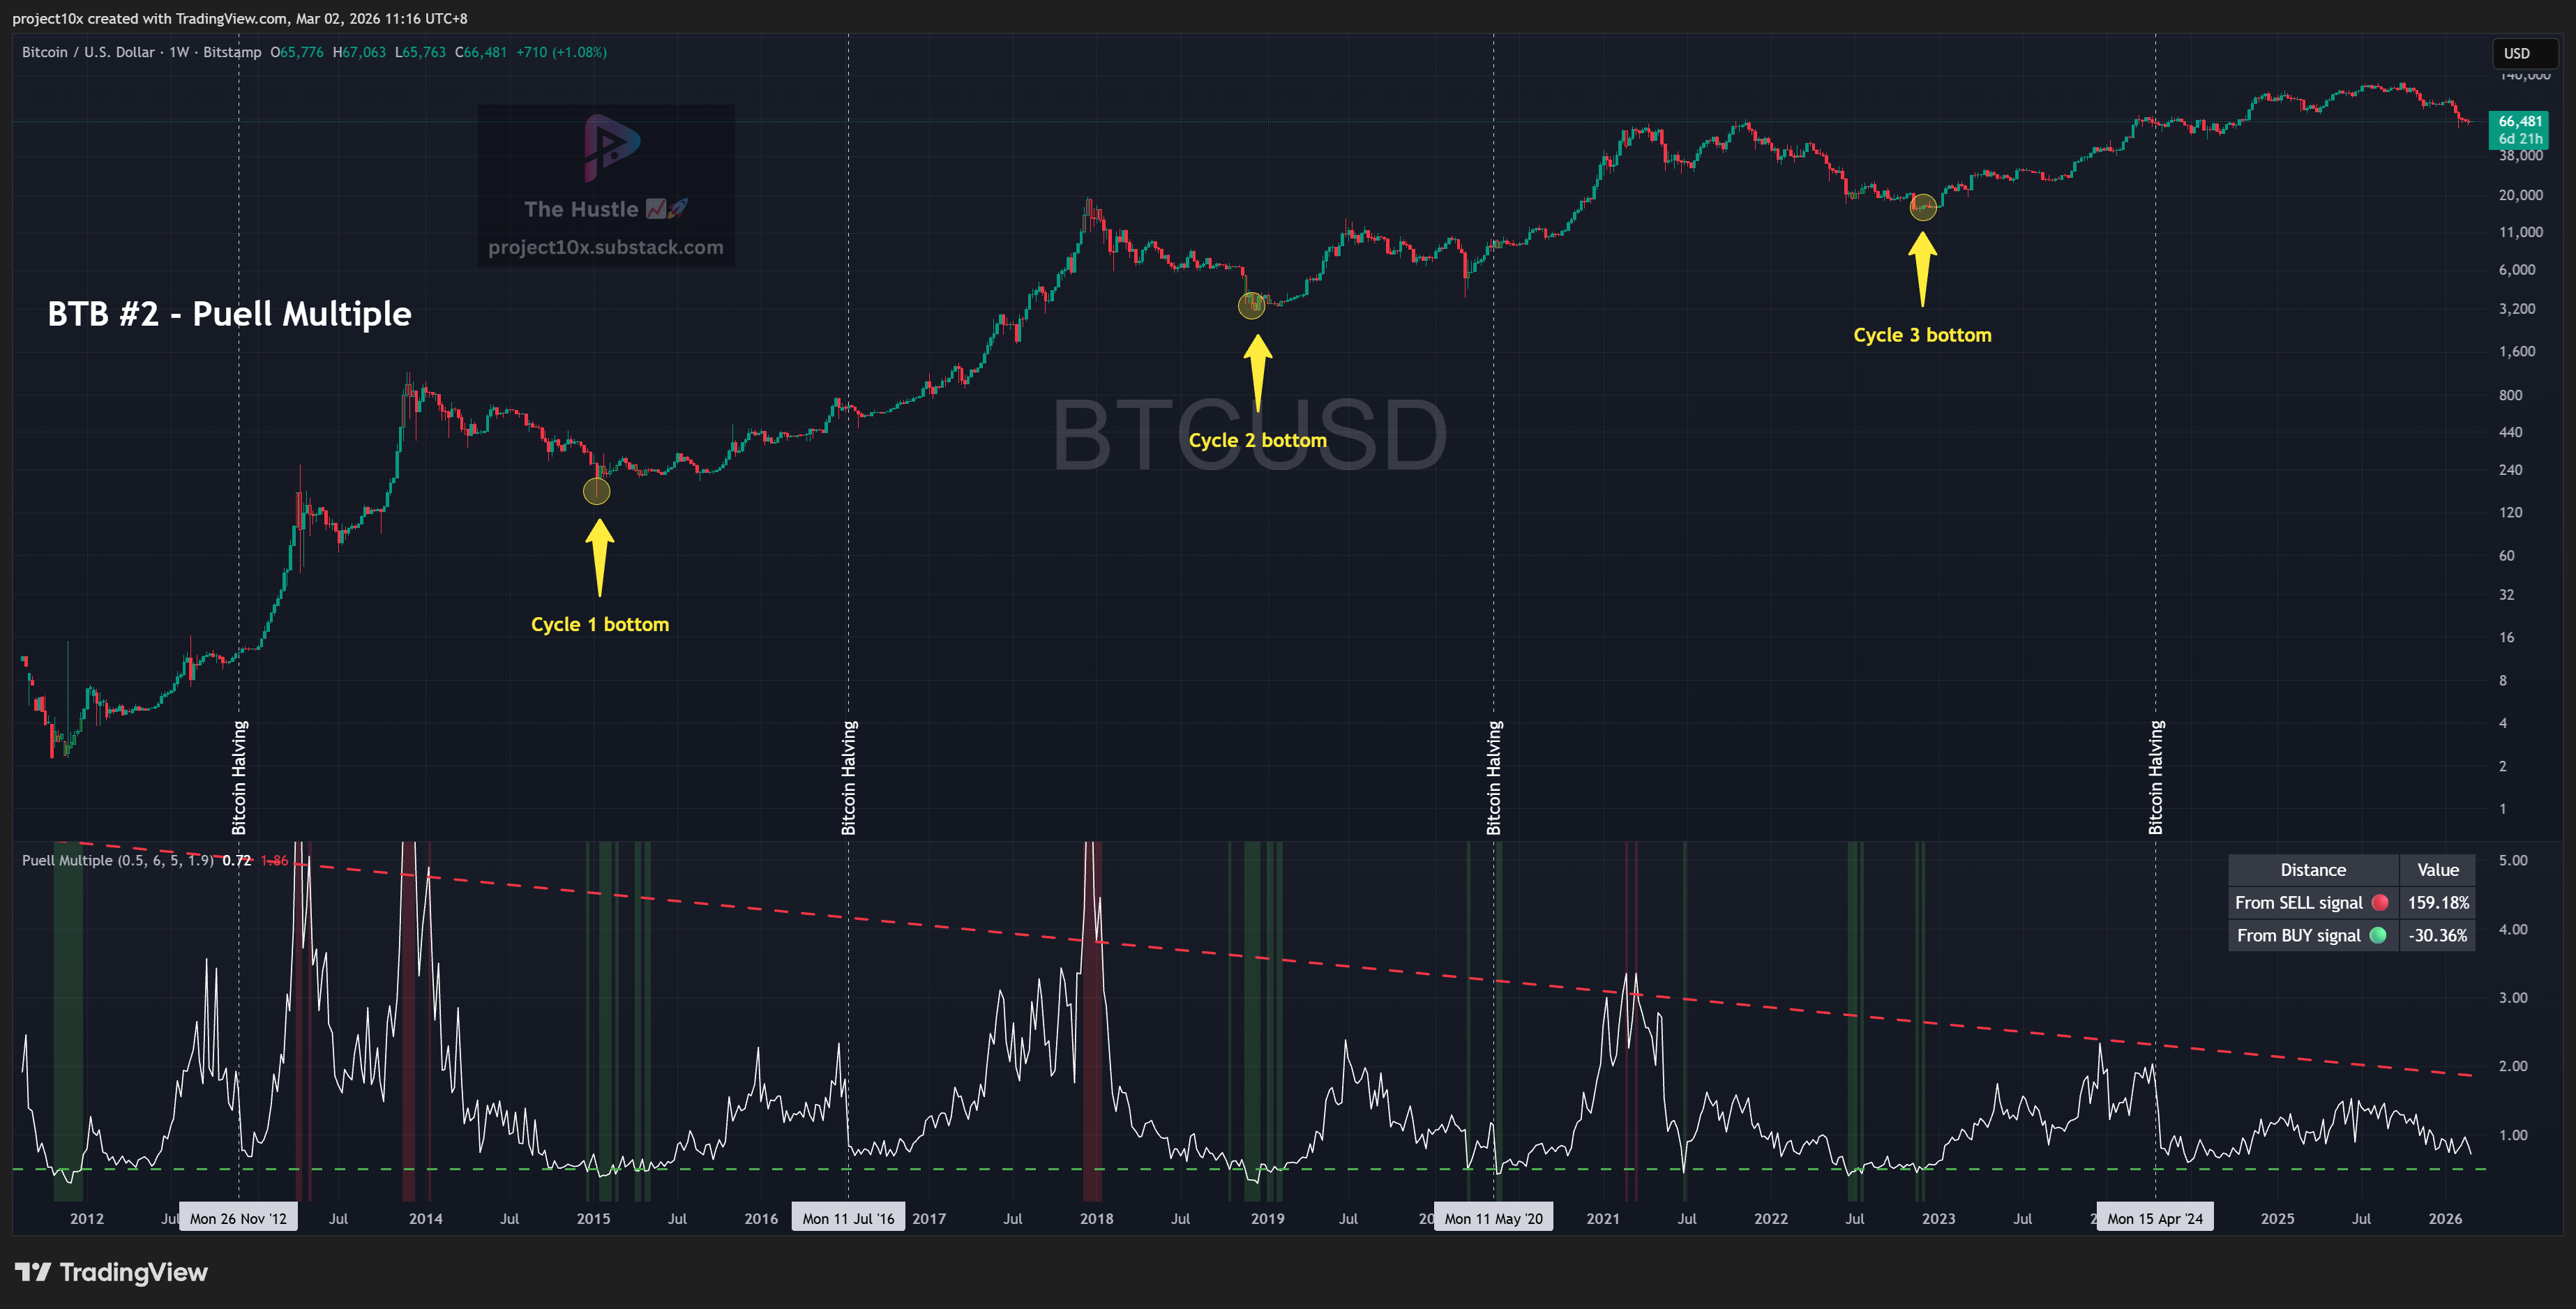
Tracks miner revenue versus its own 365D average.
≤ 0.5 has historically aligned with miner capitulation and deep accumulation zones.
Structural changes (ETFs, treasuries, maturity) may make the “0.5” line rarer over time.
What it is
The Puell Multiple compares daily BTC issuance (in USD terms) to a 365-day moving average of that value. Miners are natural sellers, so when miner revenue gets squeezed, it often coincides with systemic stress and forced selling in the ecosystem.
When it’s applicable
Most relevant in bear markets and sharp post-euphoria drawdowns.
Works best as a confirmation tool when other indicators are already “warming up”.
Use for BTC cycle analysis, not intraday decision-making.
How to use it
If Puell drops to ≤ 0.5, mark 🟢 BUY REGIME and consider adding a tranche.
If it is falling but still above 0.5, mark 🟠 WATCH and prepare.
Use context: if drawdowns are structurally shallower, the “capitulation” threshold may drift.
Common pitfalls
It’s not 1:1 with price, Puell can move due to issuance, fees, and miner behaviour changes.
Thresholds may evolve as miners become a smaller share of marginal sell pressure.
Don’t use it alone as an “all-clear”, it tells you about miner stress, not overall demand.
Current state (example)
Puell is still above 0.5, so there is 🔵 NO SIGNAL (watching, not buying).
BTB #3 - Fibonacci Retracements
Category: Behavioural support zones / cycle retracements
Summary
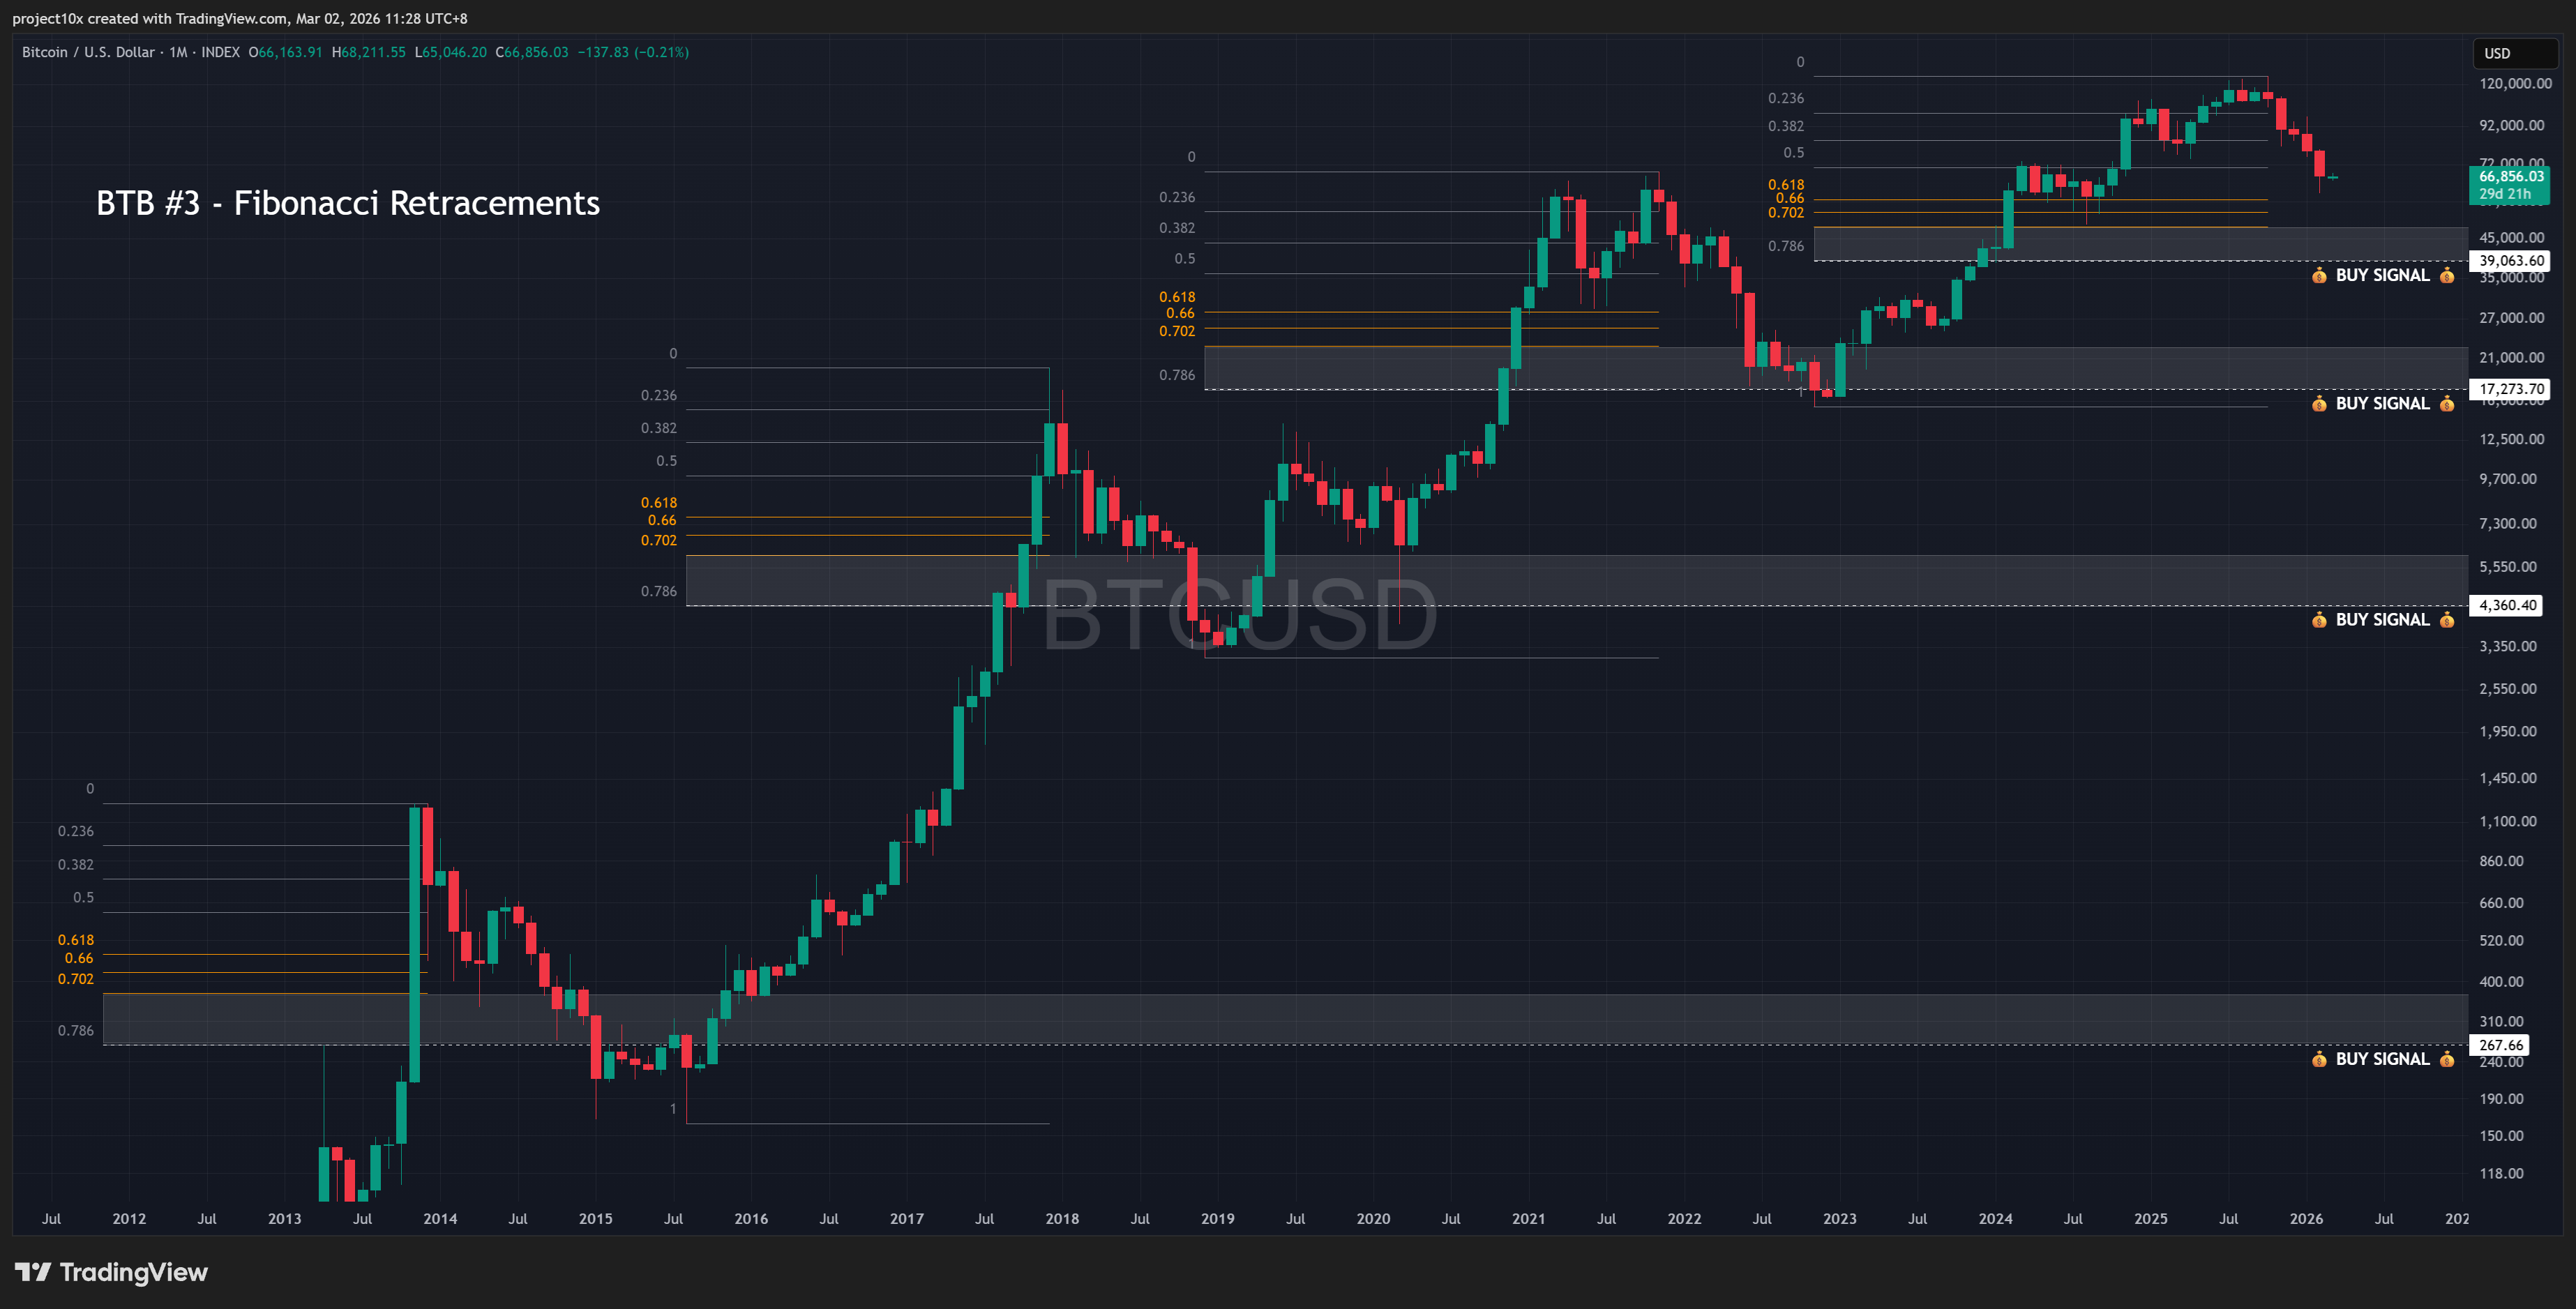
Measures how deep BTC corrects after a major impulsive cycle move.
Across cycles, deep bear corrections have often found support in 0.702 - 0.786 retracement.
Use as a “deep value zone”, not a certainty that price must go there.
What it is
High time frame (HTF) Fibonacci (Fib) retracements map common retrace depths of a major impulse move. When drawn from the cycle swing low to the cycle swing high, the fib levels become behavioural zones where long-term buyers have historically stepped in.
When it’s applicable
Best used after a major cycle peak has formed, and price is unwinding.
Helps with planning limit orders and expectation setting, not with predicting a short-term bounce.
How to use it
Mark the 0.702 - 0.786 band as your “deep value” support zone.
If price enters the band, treat as a high-probability accumulation area.
If price never reaches the band, that can still be bullish, it may reflect a structurally shallower drawdown. My base case (March 2026) is that we don’t see this level of drawdown given the bullish macro-backdrop.
Common pitfalls
Anchor point selection is subjective. Different anchors = different Fib levels.
Markets can front-run deep zones in mature regimes, so don’t “wait forever” for a perfect Fib tag.
Fib is not a catalyst, it’s a map. You still need a reason for sellers to exhaust.
Current state (example)
The buy zone is $40-$50K, so there is 🔵 NO SIGNAL. That said, anything close to those levels in this regime i.e. the golden pocket (0.618 -0.702 Fib, $50-$60K) is a BUY from my perspective.
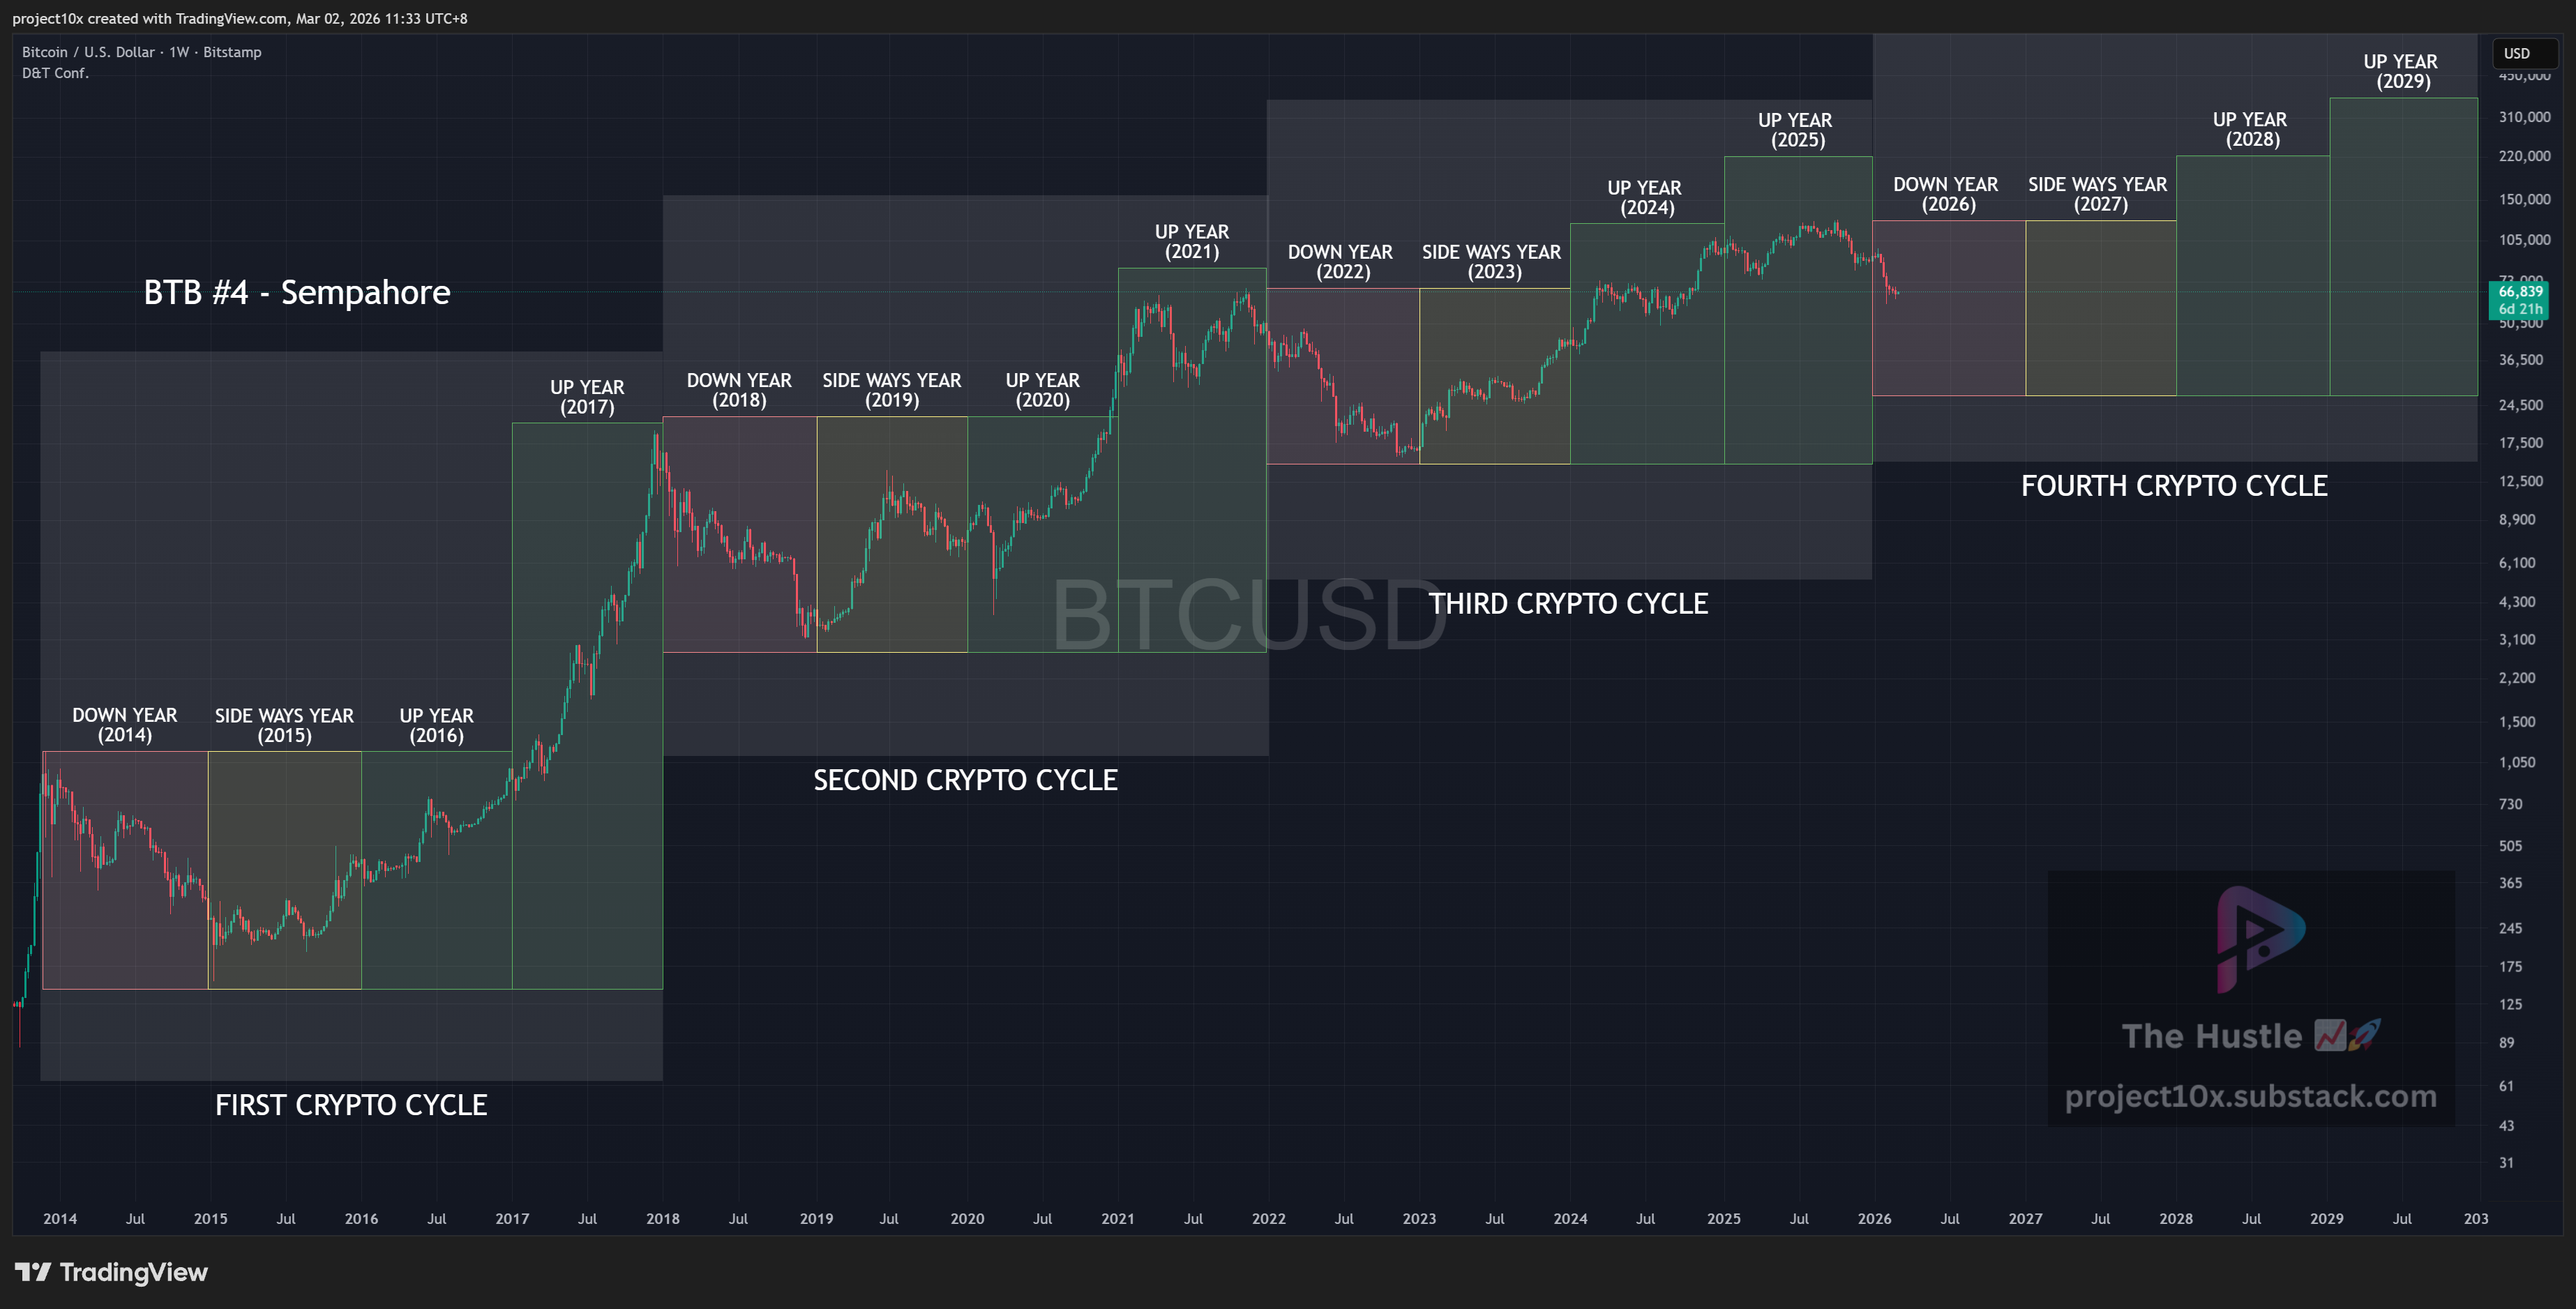
BTB #4 - Semaphore
Category: Time-based cycle model
Summary
A time-based interpretation of the 4-year BTC cycle rhythm.
Splits a cycle into down year🔴, sideways year 🟡, and two up years 🟢🟢.
Useful for patience and expectation setting, not for low-time-frame (LTF) timing.
What it is
The Semaphore is a time-based indicator built around the 4-year cycle theory. It’s a simple framing device: cycles tend to repeat a rhythm of contraction, re-accumulation, breakout, then expansion.
When it’s applicable
Best as a regime guide when you’re prone to overreacting to bear-market rallies.
Useful for aligning your expectations (how long bottoms can take).
Should be used alongside capitulation indicators.
How to use it
Use it to set your default expectation for when the market is more likely to bottom.
In “down year”, treat big rallies as rallies first, trend reversals second.
As you approach the end of the down year, get ready to deploy more aggressively, especially when other indicators confirm.
Common pitfalls
Cycles can be front-run (or delayed) by liquidity conditions, policy shifts, and new market structure.
If you treat it as a prediction tool, it will annoy you. Why? Because the “4-year cycle” is a meme. A reflexive loop. If you treat it as a patience tool, it becomes useful.
Time-only models don’t capture capitulation intensity.
Current state (example)
We are early in the bear market, and while there will be large rallies, we can expect a HTF trend lower into Q3 2026, where we bottom.
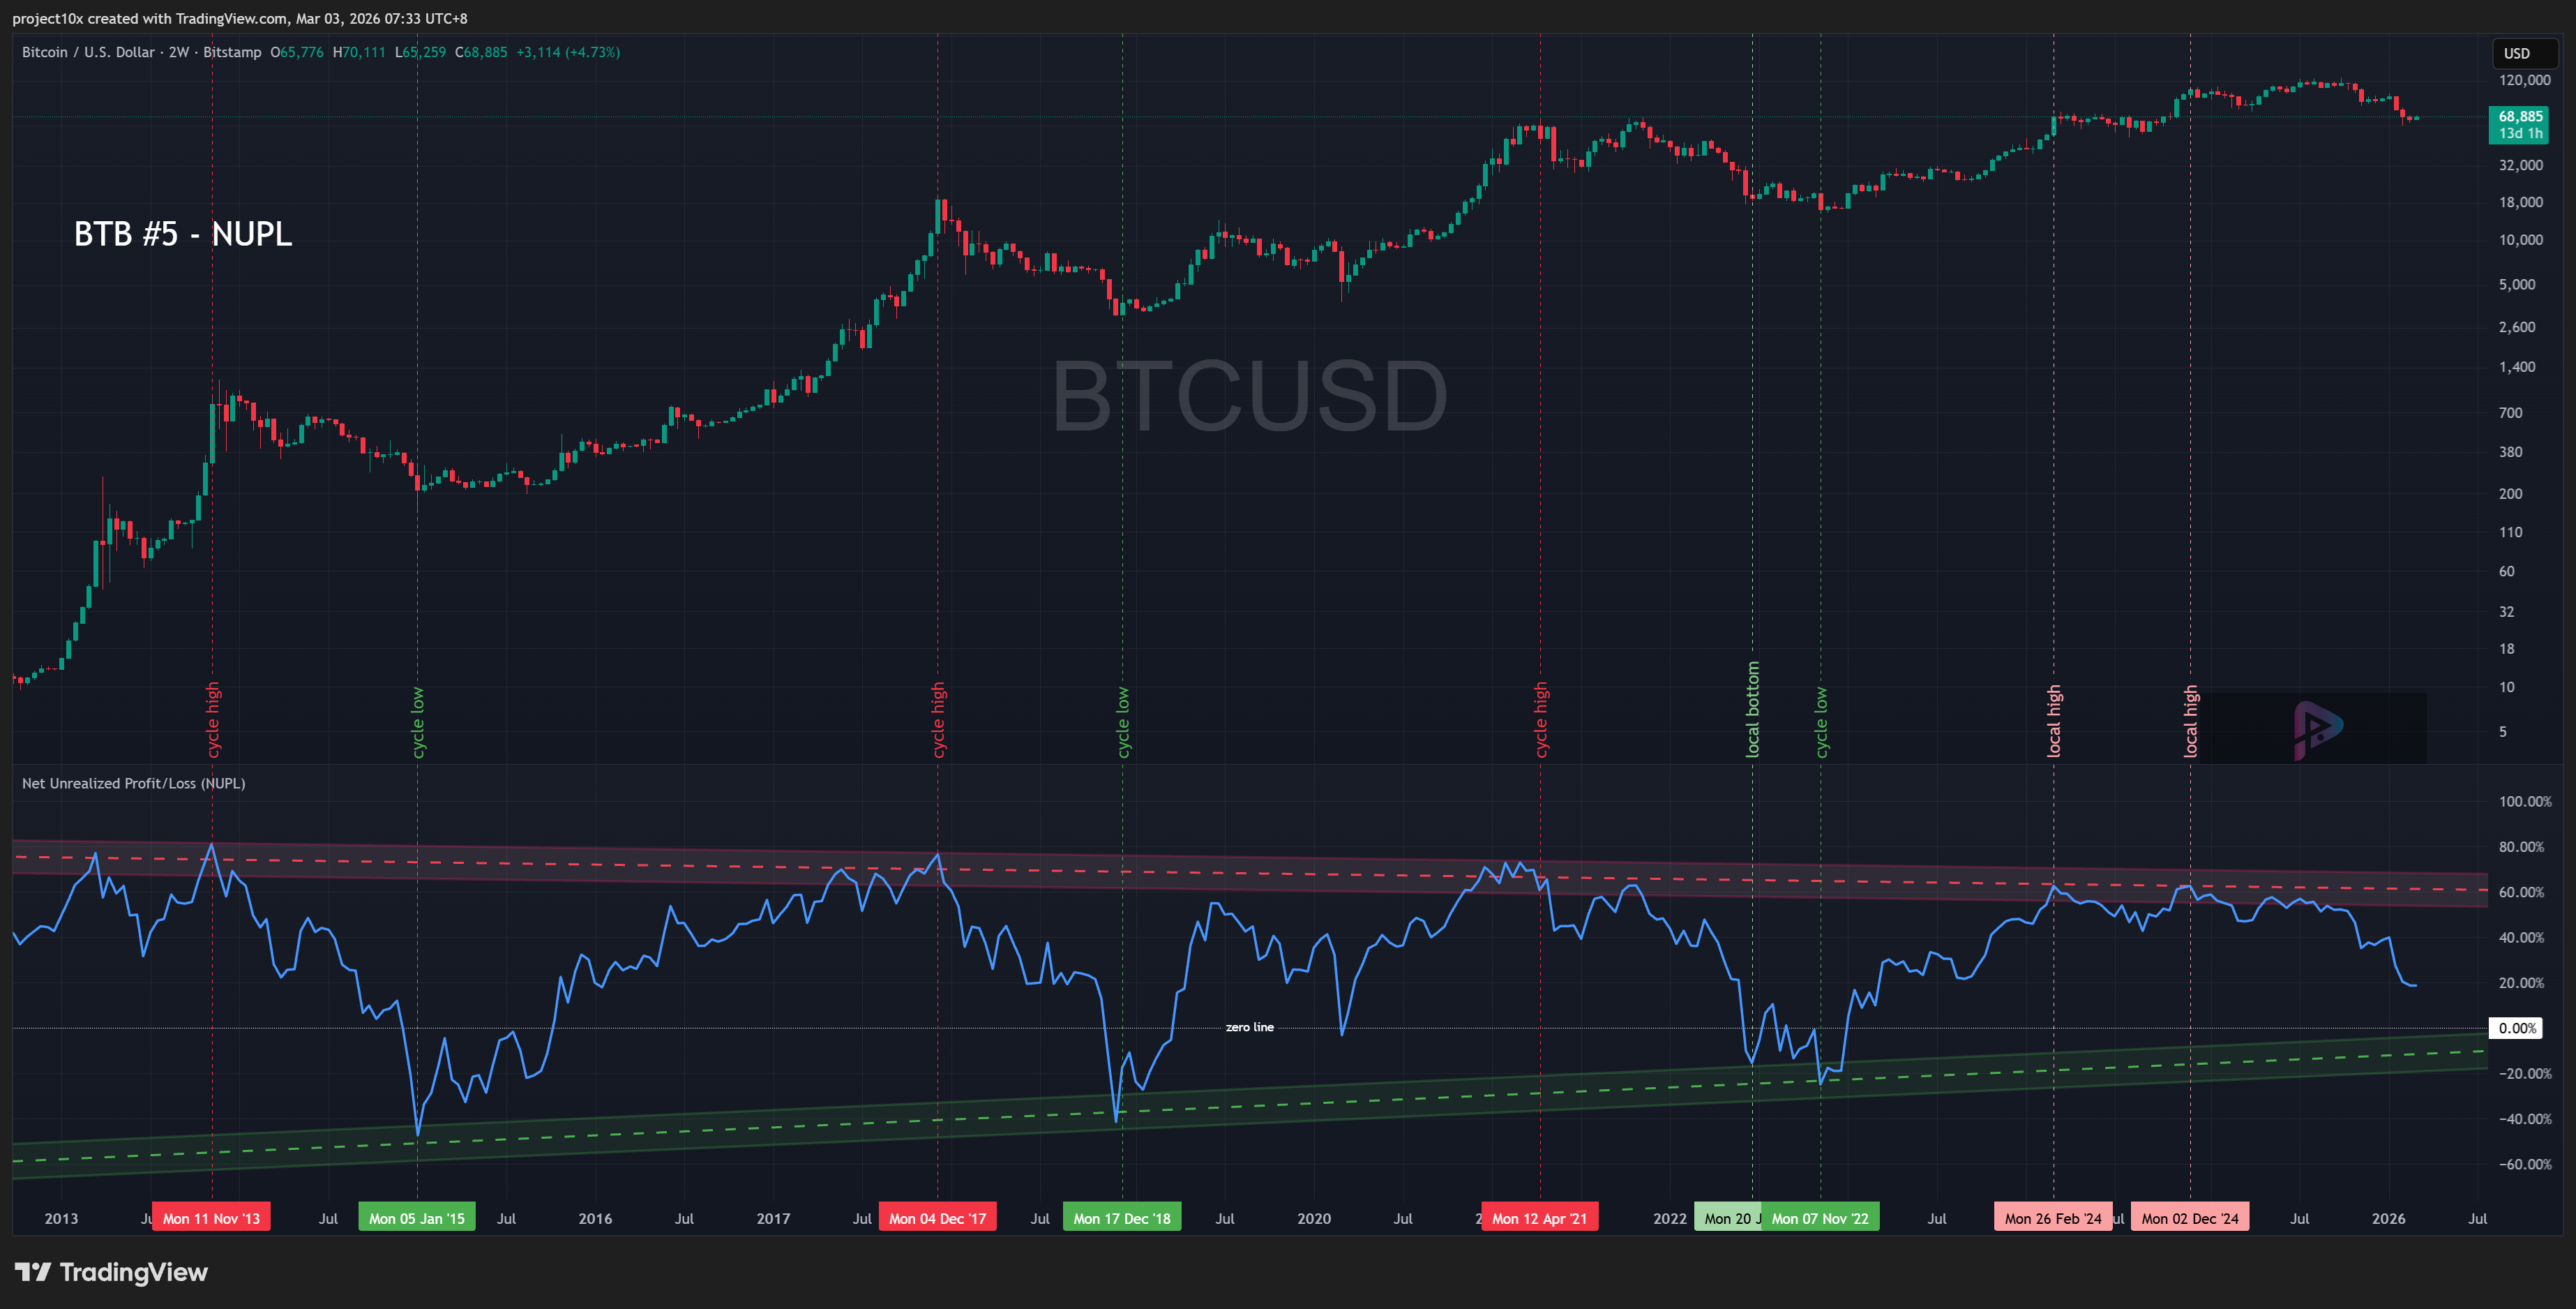
BTB #5 - Net Unrealised Profit/Loss (NUPL)
Category: Holder P/L + capitulation temperature check
Summary
Measures how much of the market is sitting in unrealised profit vs loss.
Historically, bottoms form as profit cools to negative values (with a rising floor), and sellers get flushed.
A rising floor signals diminishing downside across cycles.
What it is
NUPL approximates the proportion of market cap that is sitting in unrealised profit or loss. When NUPL is high, most holders are in profit. When it is low or negative, losses are widespread, investor sentiment and psychology is distressed, which is often where long-term opportunity shows up.
When it’s applicable
Most useful during full-cycle drawdowns and late-stage capitulation phases.
Works best as a temperature gauge alongside price structure and liquidity context.
How to use it
Treat the 0% region as the BTB focus area; below this is typically the final capitulation zone.
Watch for an “ascending accumulation floor” across cycles, meaning each bottom can occur at a less-negative level than the prior one. This is how the green dashed floor line has been modelled.
Use it to manage urgency: if NUPL is still meaningfully positive, there is usually no rush to buy.
Common pitfalls
It’s slow and can stay depressed for a while, that’s normal in bear markets.
On-chain metrics can be affected by market structure changes (ETFs, DATs, off-chain activity).
Don’t try to bottom tick with this indicator; recognise the regime and value zone (below zero).
Current state (example)
NUPL is pointing to an accumulation zone, buying-the-bottom levels around the 0% region. We have a while to go before we get there. There is no rush to buy anything right now according to this indicator.
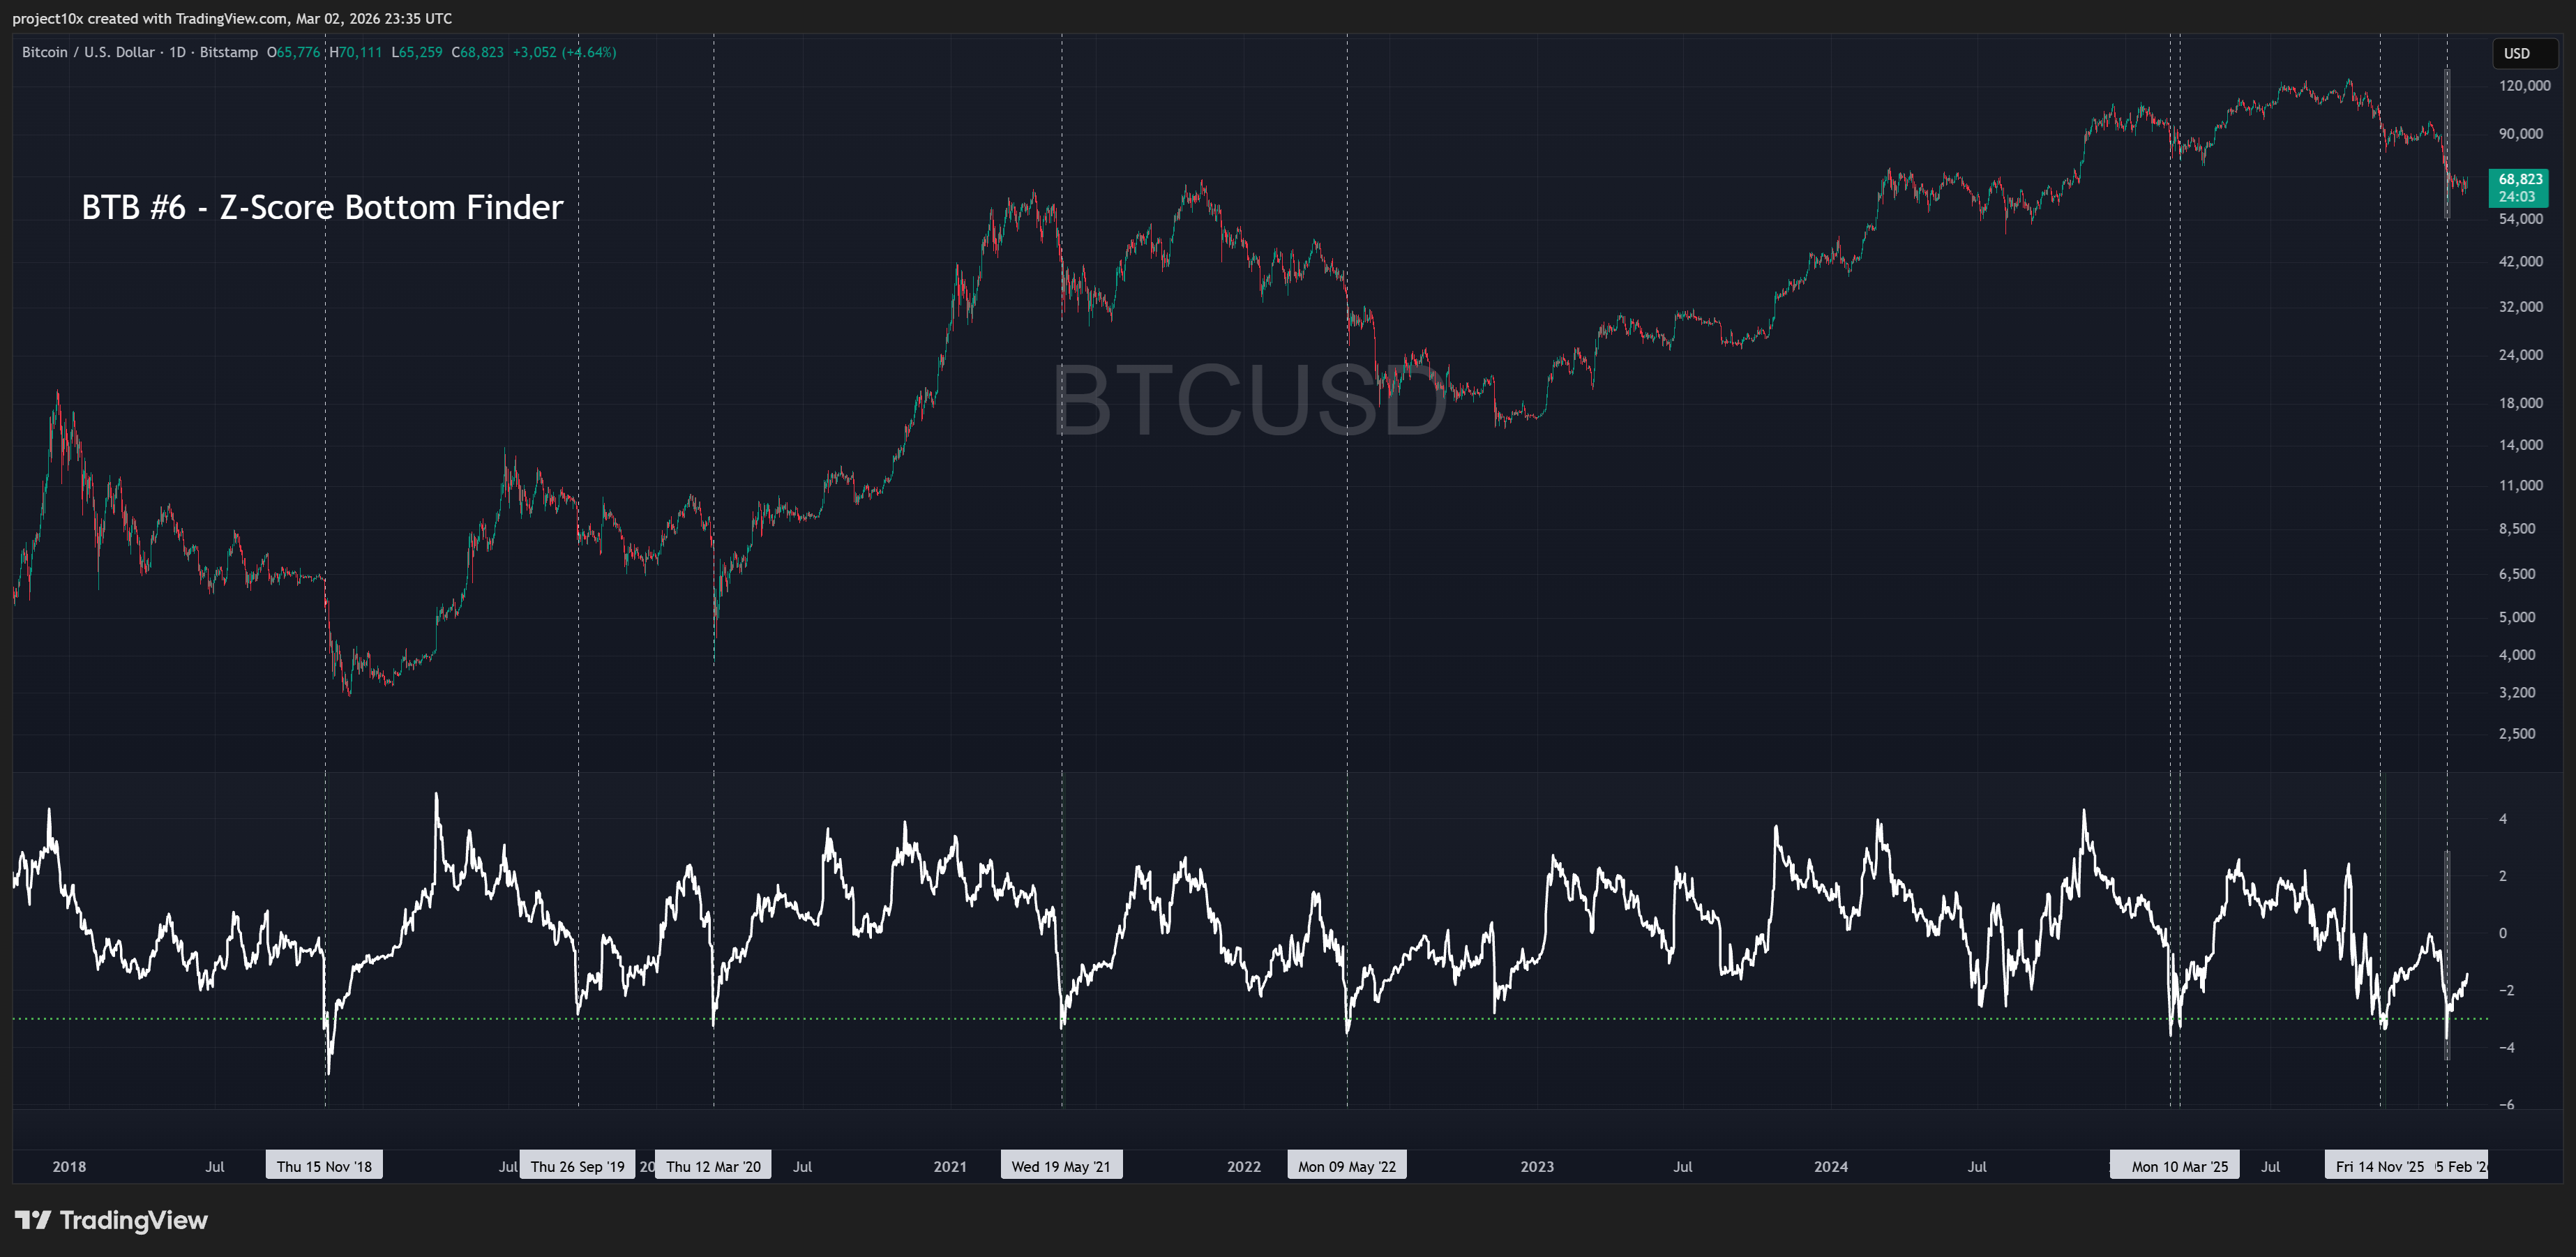
BTB #6 - Z-Score Bottom Finder
Category: Statistical dislocation (oscillator)
Summary
This isn’t a pure cycle-bottom indicator. It’s a local and cycle-bottom tool, and we use it directly inside our Capital Deployment Framework (CDF).
This is an “extremes” detector, it tells you when price is unusually stretched to the downside versus its own normal behaviour.
The trigger is a 3-sigma downside event, that is rare, and it’s meant to open the Discount Window, not call the exact bottom.
What it is
The Z-Score Bottom Finder measures how far price has deviated from its typical range, expressed in standard deviations. In plain English, it answers: “Is this move abnormally extreme for this market?”
When it’s applicable
Best on HTF.
Most useful during sharp sell-offs, early to mid-cycle, or late bear market.
How to use it
🟢 BUY REGIME: when the indicator prints a 3-sigma downside event, treat that as “Discount Window open”.
Stack it: it’s most powerful when it lines up with our cycle regime tools (Monthly RSI, NUPL, Puell). That’s when we have both “cheap” and “capitulation”.
Common pitfalls
It can stay extreme for longer than we want. Bottoms are processes, not single candles.
It’s not a precision tool. Don’t wait for the perfect print, then try to go all-in on one entry.
Current state (example)
Last triggered on 5th Feb 2026 - that is the local bottom as at the time of writing (March 2026)
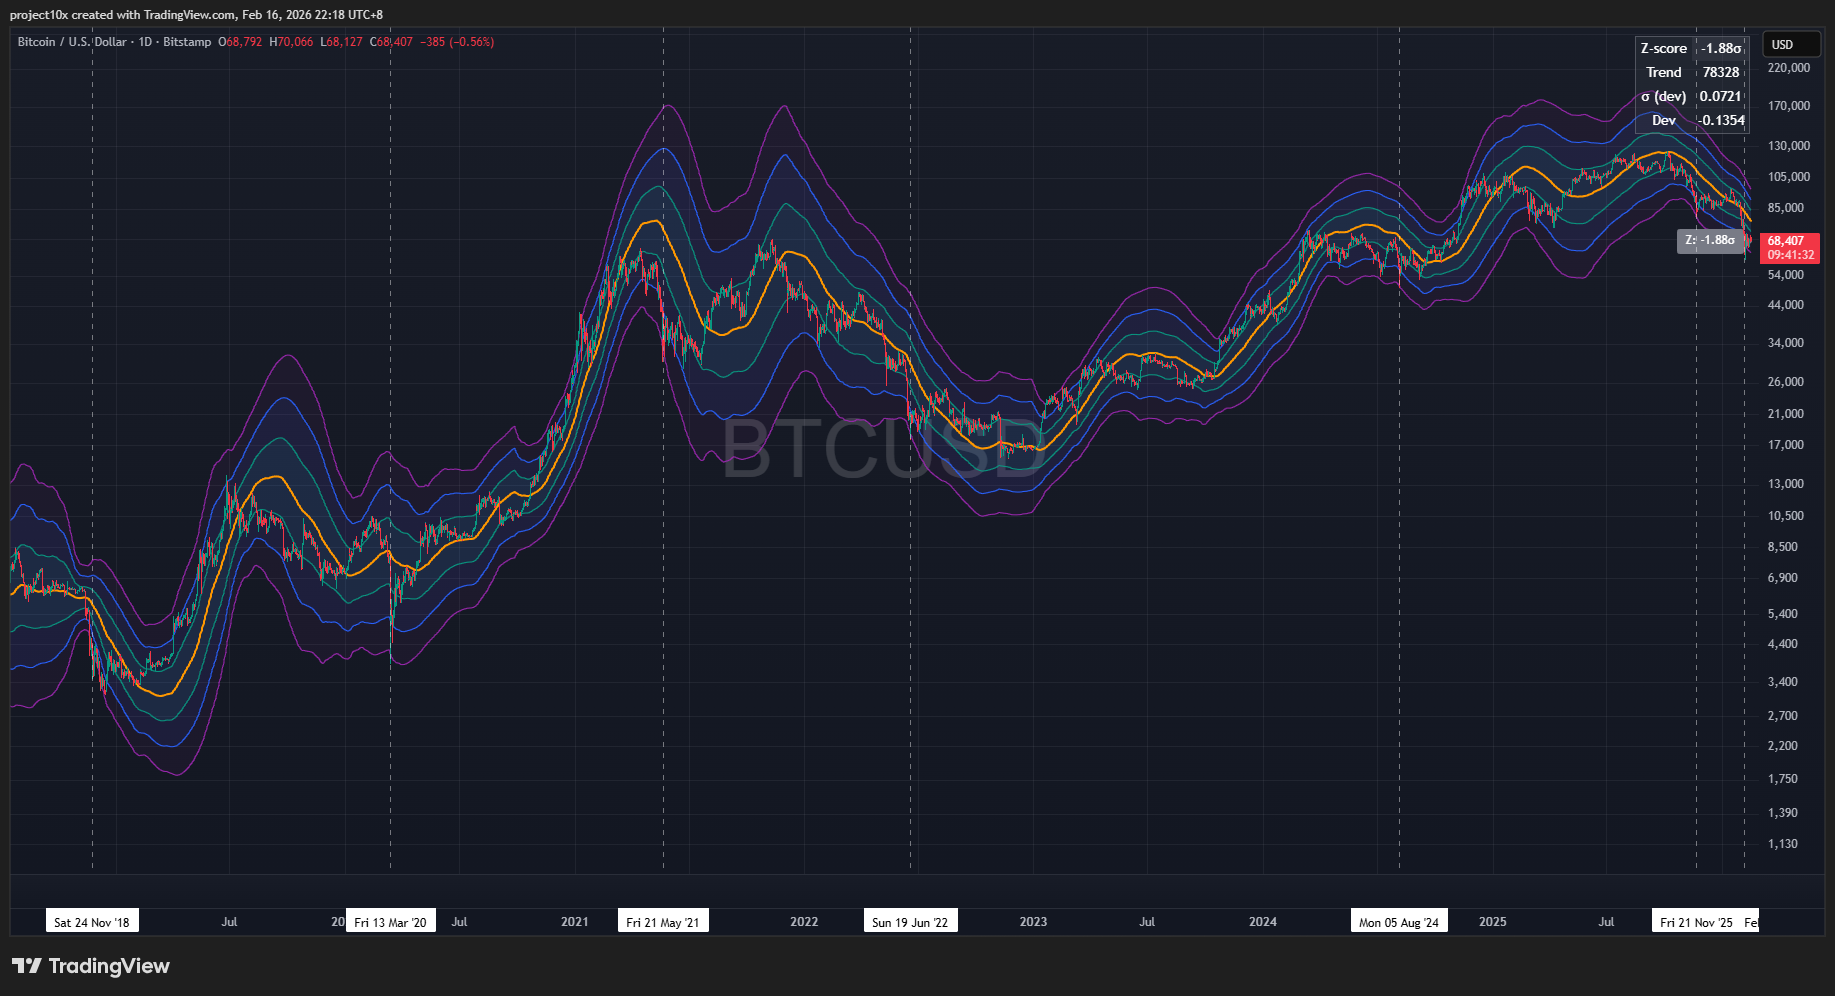
BTB #7 - Trend Sigma Bands (Trend σ)
Category: Trend-relative dislocation (bands on chart)
Summary
This isn’t a pure cycle-bottom indicator. It’s a local and cycle-bottom tool, and we use it directly inside our Capital Deployment Framework.
This maps price versus a long-term trend baseline, then builds sigma bands based on how volatile that trend-deviation normally is.
It’s designed to be scale-aware, so “stretch” is comparable across different price regimes.
Use it as a visual framework for deep-discount zones, with the lower 3σ region as the main BTB focus area.
What it is
Trend Sigma Bands answer a slightly different question to the Z-Score. Z-Score measures how extreme price is versus its own average, Trend Sigma measures how stretched price is versus the long-term trend (band-style), so they can trigger at different times and they complement each other when stacked.
The output is a set of bands that visually show when price is stretched 1, 2, and 3σ in either direction.
Green = ±1σ
Blue = ±2σ
Purple = ±3σ
When it’s applicable
Best on HTF where we care about structural dislocation, not day-to-day noise.
Particularly useful across long BTC history where the price level changes dramatically, because it keeps the concept of “stretch” consistent.
Most valuable when markets are trending down and we’re looking for zones to plan tranche deployment (per the Capital Deployment framework).
How to use it
🟠 WATCH: price tags the lower 2σ area, start preparing tranches, set expectations for volatility, don’t rush.
🟢 BUY REGIME: price pushes into deeper lower-band territory (the 3σ style “panic” zone), treat that as Discount Window open, scale in per the CDF rather than trying to nail a single entry.
Stack it: if Trend Sigma is 3σ while the BTB indicators are also flashing, that’s when the signal is strongest.
Common pitfalls
Band signals can cluster during heavy downtrends. That’s not “broken”, it’s the market telling you the regime is stressed.
Don’t treat a single tag as “the bottom”. Use tranches and time as your edge. This is what the CDF is all about.
Keep this as a system. If you constantly change the baseline or the framework, you lose comparability.
Current state (example)
Last triggered on 5th Feb 2026 - that is the local bottom as at the time of writing (March 2026)
I entered into a copy trade with you on E-Toro solely to get out somewhere near the top and avoid a bear market. I got out late January 2022 and was just above water including a big bag of shitcoins using my own skills. I figured this time i would get guidance. To start to buy now (February)or suggest we are at the bottom when time capitulation has not even really begun is what has me upset. I understand you are way more technically skilled than me. It feels like i have been given hope to keep my money in the copy trade.
I loved crypto for 5 years. Still sorta do. To ignore the incredibly obvious 4 year cycle now is like clutching at straws to identify as a contrarian. Follow Ben Cowen. Nuclear engineer. Logical and way smarter than most crypto gamblers. He has been right the last 4 years at every step along the way. History sorta repeats. Cycle lows late this year. $30k is my call. To get people onbard now is idiotic and selfish.