

Welcome 👋🏽
Today I share another indicator that I’ve added to the Normie Tier.
It’s called the MVRV Z-score and its performance as a sell signal in the last 3 cycles is nothing short of amazing👇🏽
Now, when you put 26 more indicators that are just as good alongside the MVRV Z-score, that’s a motherf****** exit strategy you can count on.
That’s what the “Selling the Top” newsletter series is all about.
➡️ Free subscribers get monthly updates…for FREE.
➡️ Paid subscribers receive weekly updates.
➡️ or you could just set up and track the indicators yourself on TradingView.
I don’t care what option you choose; just make sure you have a plan and you execute that plan.
Now, let’s see how we can use MVRV Z-score to make some money!👊🏽

⚠️ DISCLAIMER ⚠️
The content provided by PROJECT 10X PTY LTD (Filip Brnadic) is for educational purposes only and is not financial or investment advice. PROJECT 10X PTY LTD is not a licensed financial adviser under Australian law.
Investing involves risk, including the potential loss of all funds. Seek independent advice before making any financial decisions.
Summary - MVRV Z-score
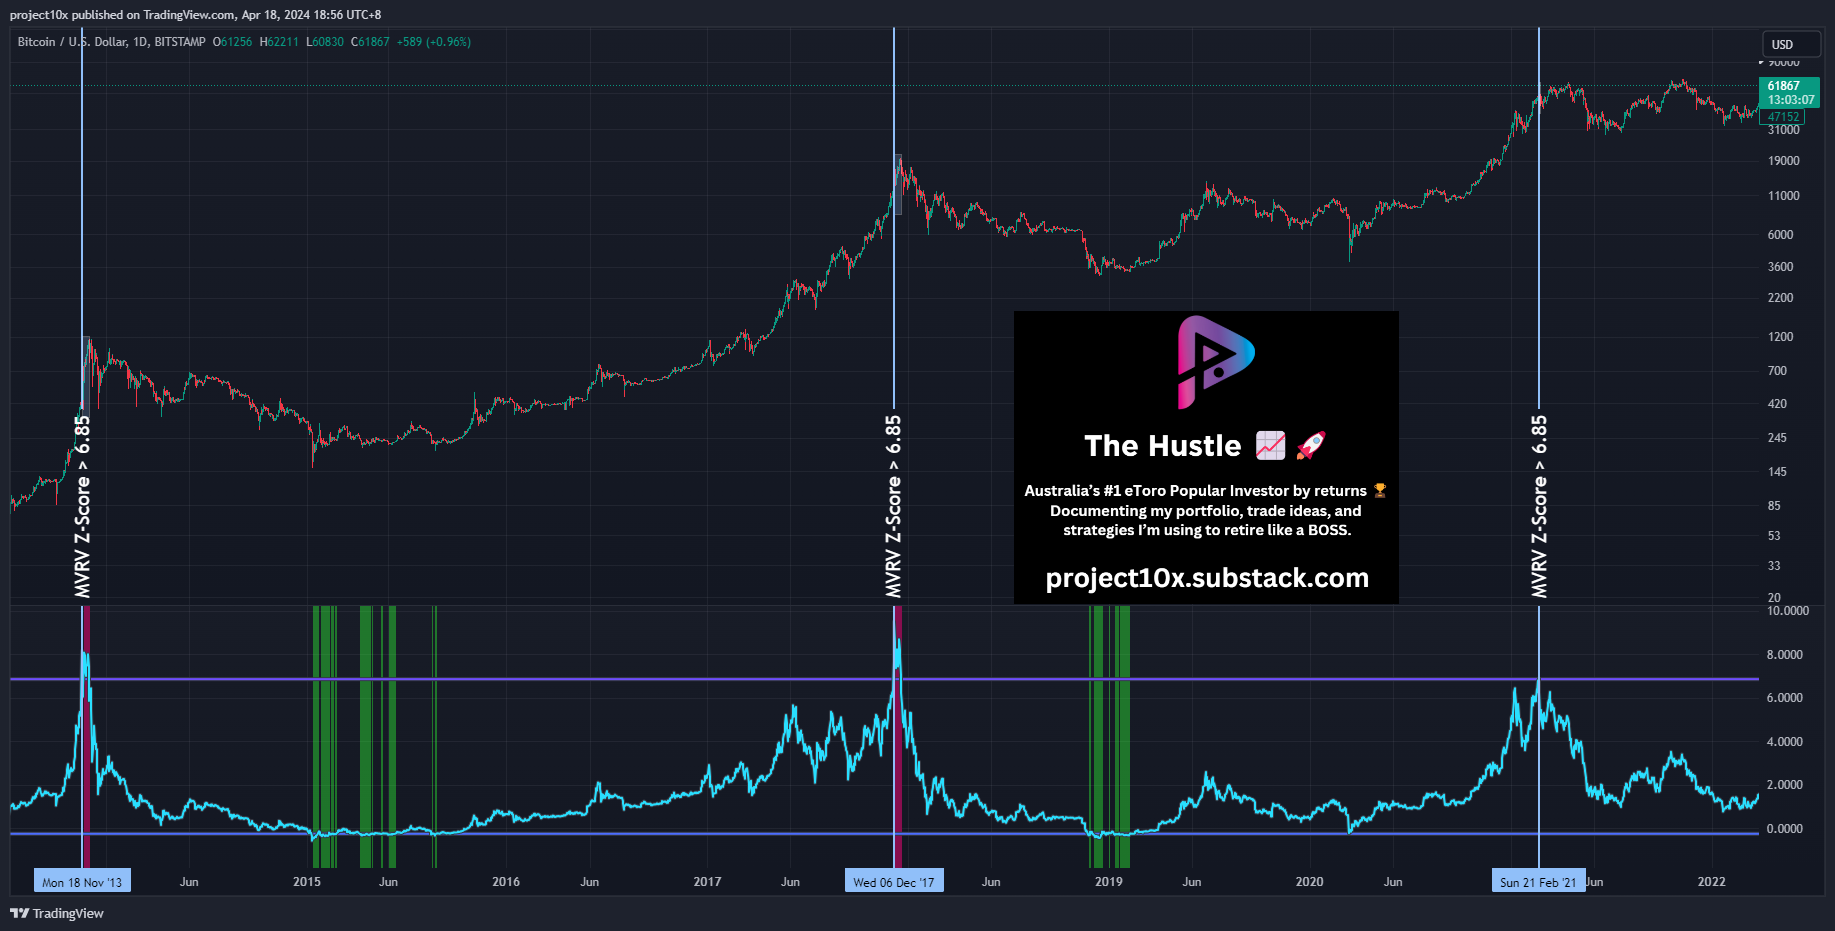
The MVRV Z-score uses blockchain analysis to identify periods where Bitcoin is overvalued or undervalued relative to its 'fair value'.
The Z-score is a standard deviation test that pulls out the extremes in the data between market value and realised value. Market value is the current price of Bitcoin. Realised Value takes the price of each Bitcoin when it was last moved (the last time it was sent from one wallet to another). It then adds up all those individual prices and takes an average of them. It then multiplies that average price by the total number of coins in circulation.
MVRV Z-score has picked major local tops in Bitcoin to within 2 weeks and it is accurate as f****.
This newsletter is brought to you by eToro.
eToro is a social trading platform that allows users to trade stocks, cryptocurrencies and copy top-performing traders.
eToro has over 35 million registered users from more than 100 countries.
eToro AUS Capital Limited ACN 612 791 803 AFSL 491139. Social trading. eToro does not approve or endorse any of the trading accounts customers may choose to copy or follow. Assets held in your name. Capital at risk. See PDS and TMD
Picking Cycle Tops 📈
Signal: when the z-score (light blue line) hits 6.85 (purple line), it marked the local top within 2 weeks in the last 3 crypto cycles, using the D1 chart.
Now, let’s zoom in and see how it performed as a cycle top indicator.
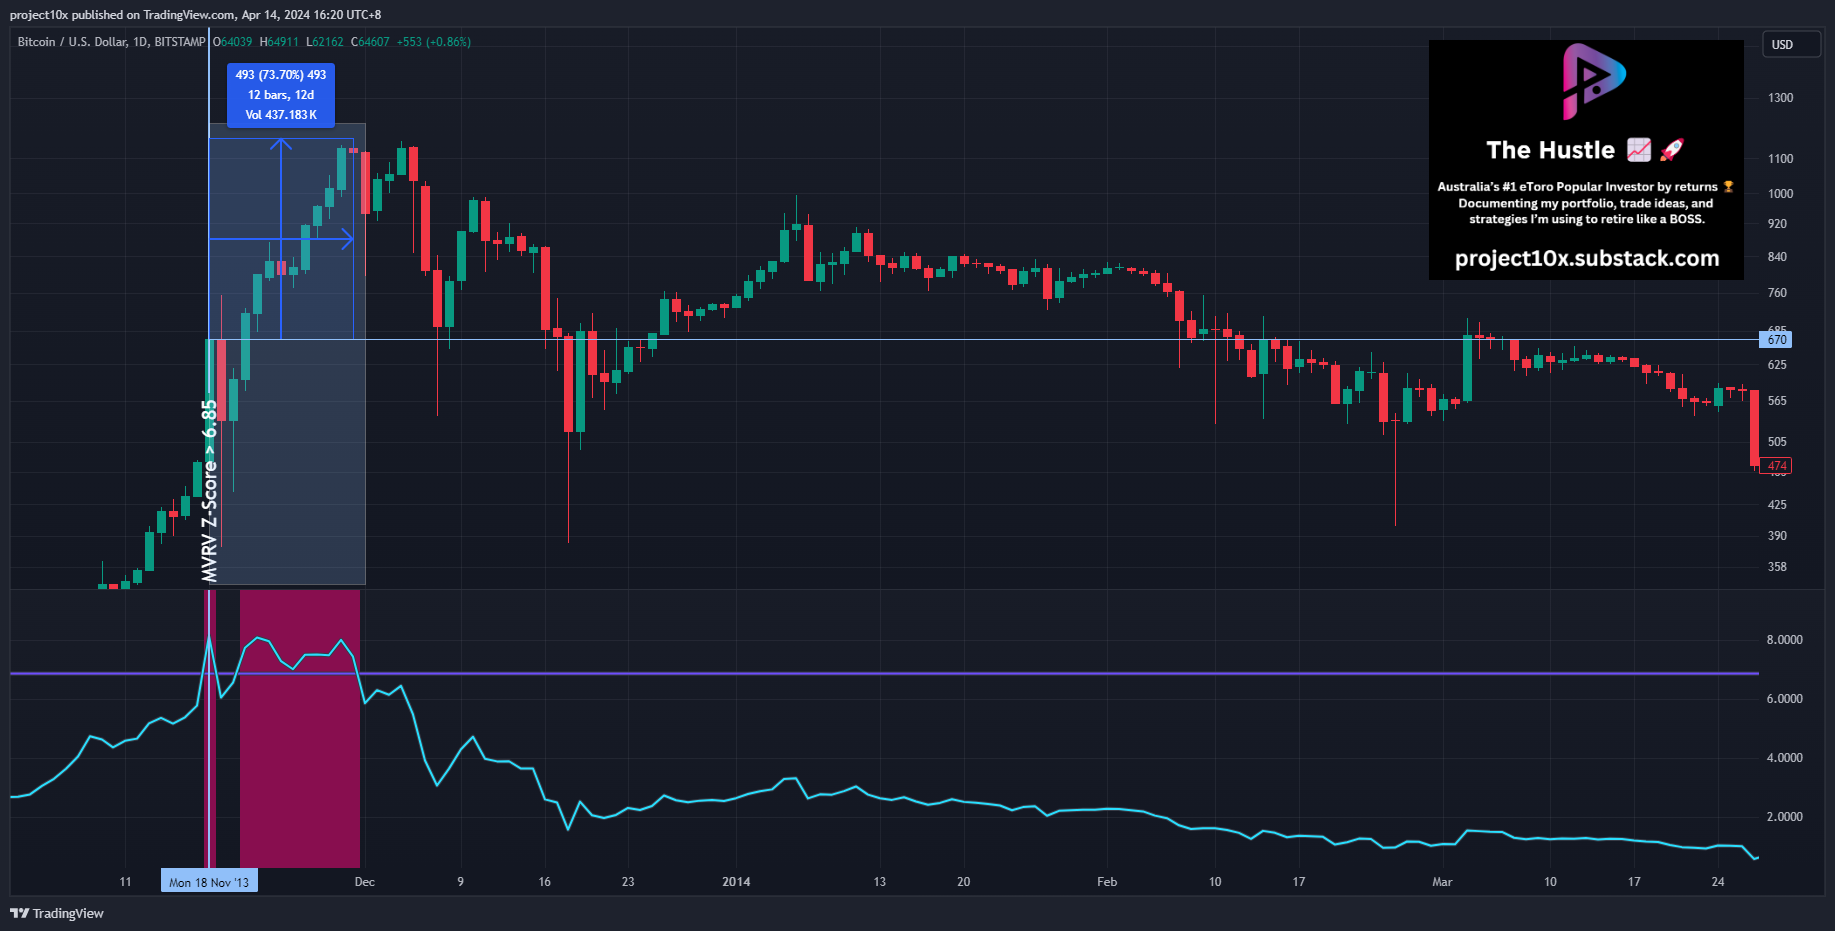
2013
Distance from highest price: -73%
Duration to highest price: <2 weeks
Despite these being very volatile times in Bitcoins early existence, the MVRV Z-score started to signal less than 2 weeks before price topped. We missed out on some upside here, but still a great exit point nonetheless. Remember, you won’t always nail the absolute top and that should never be the goal.
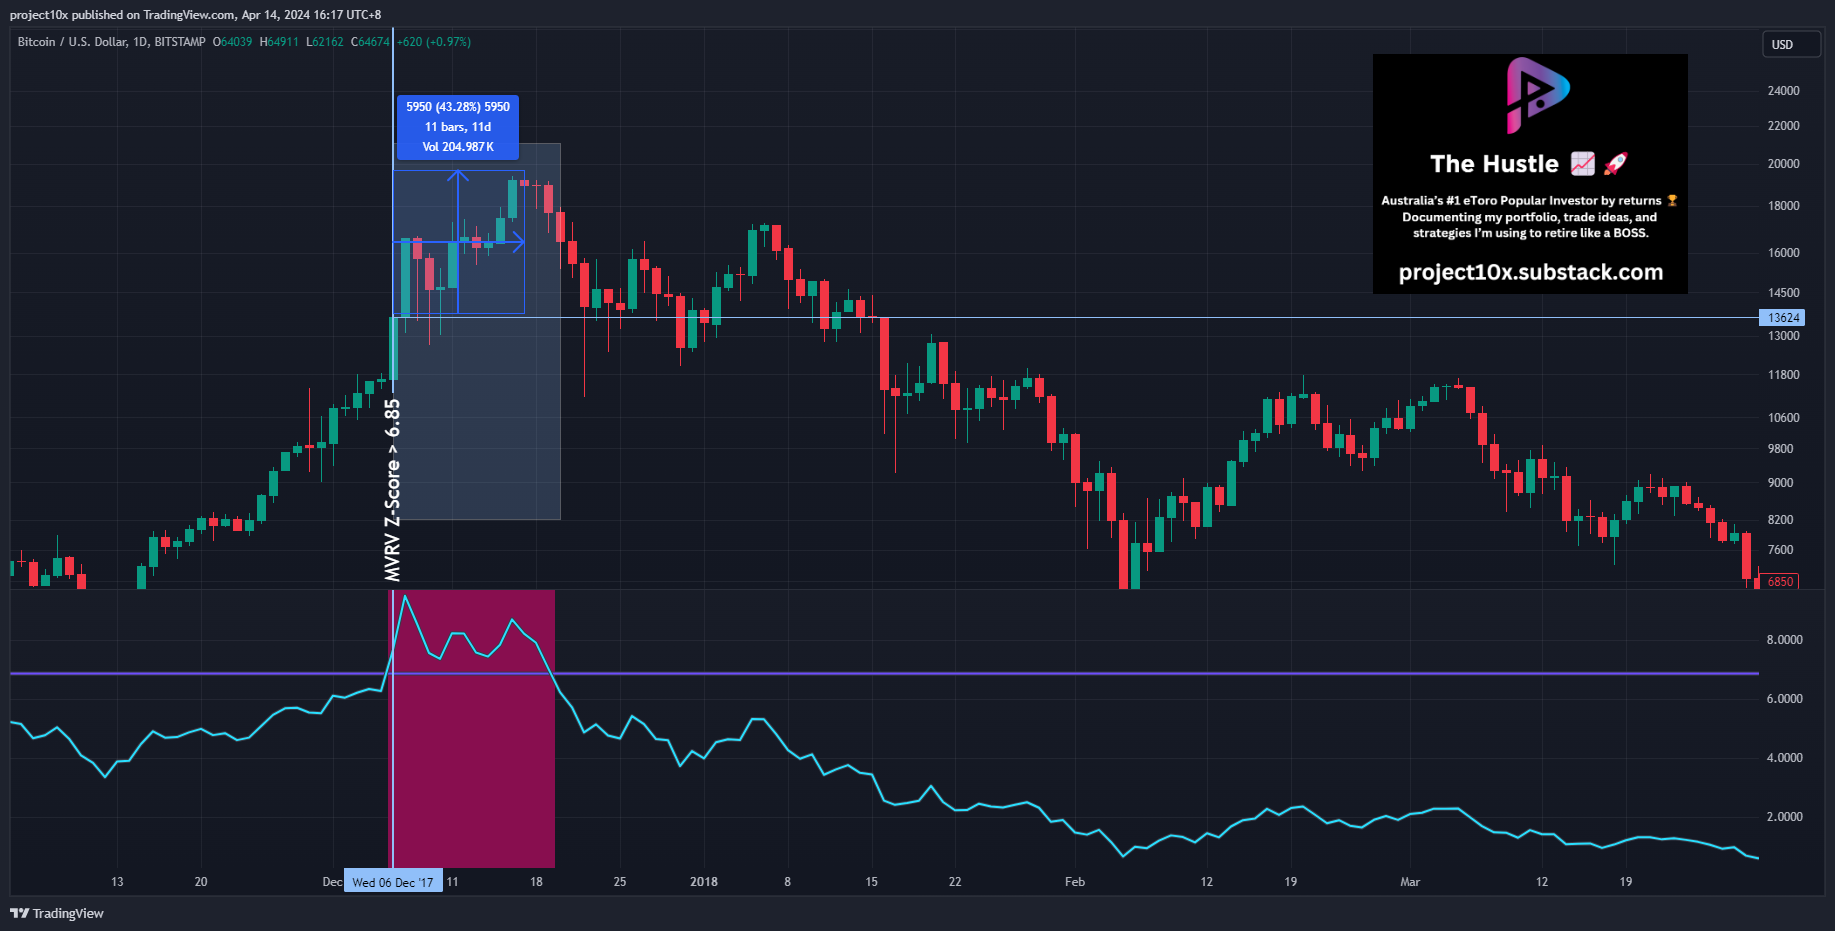
2017
Distance from highest price: -43%
Duration to highest price: <2 weeks
You’re probably starting to get a sense that once this indicator starts signalling, the top is in any day after that. This was an excellent signal.
2021
Distance from highest price: -11%
Duration to highest price: <7 weeks
You’re probably realising that the MVRV Z-score is getting more accurate in terms of when it starts signalling and the peak price. However, this time it was a little premature 💦 in terms of the duration
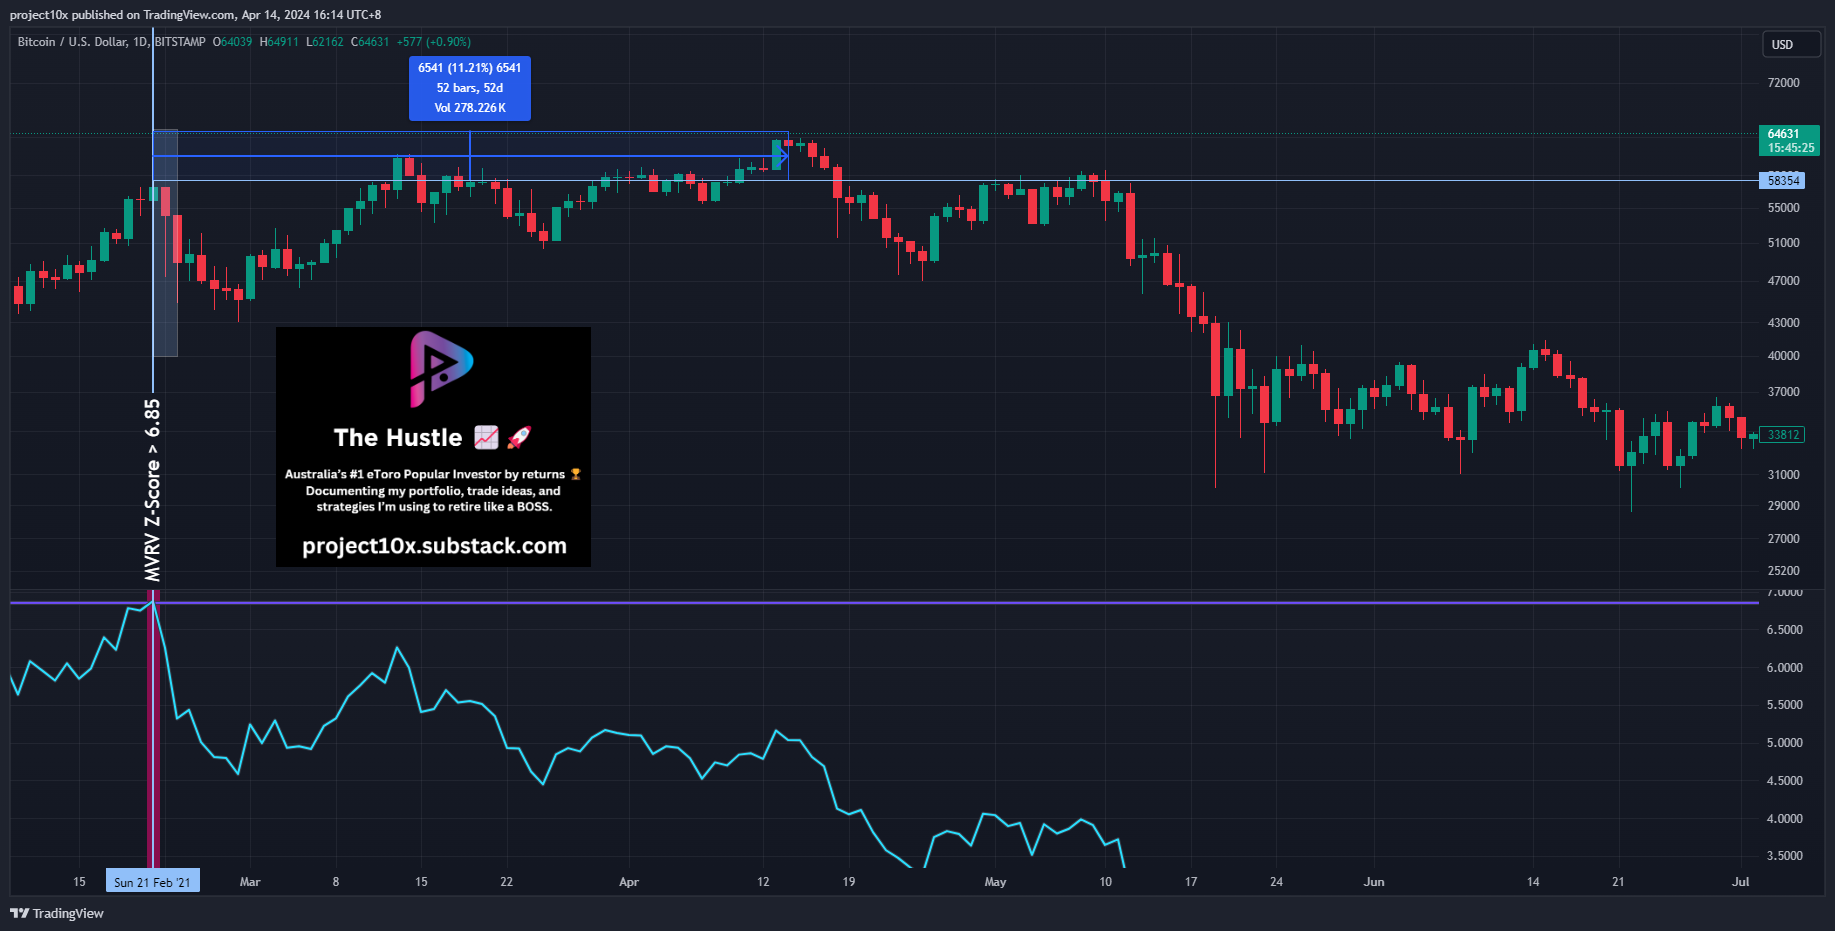
Final Remarks: Investors should be on high alert as soon as MVRV Z-score breaks the 6.85 level. It is likely that the top is in any day after that. Use the other 26 indicators as confluence and you’re bound to exit at a decent price 😉
Picking Cycle Bottoms 📉
Signal: when the z-score (light blue line) hits -0.25 (purple line), it marked the local bottom within 2 weeks in the last 3 crypto cycles, using the D1 chart.
Now, let’s zoom in and see how it performed at the bottom of the bear market.
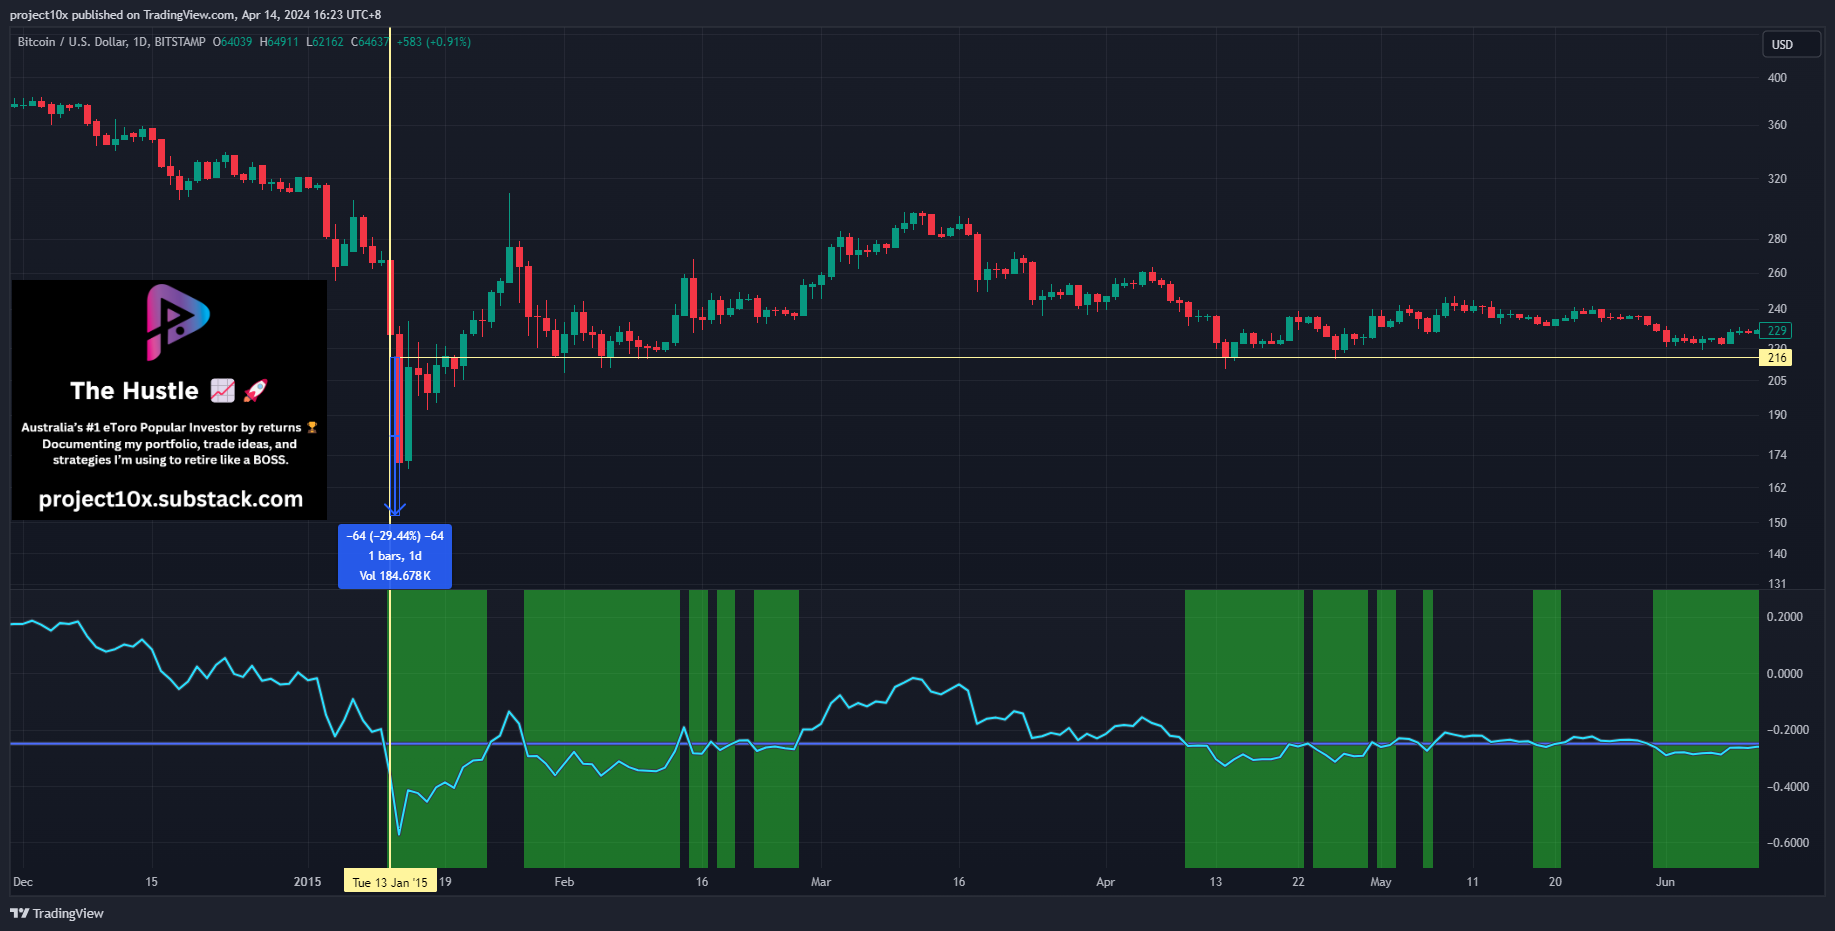
2015
Distance from lowest price: 29%
Duration to lowest price: <1 week
Bro. Imagine buying BTC at $216 when the bottom was $159. That’s fu***** impressive.
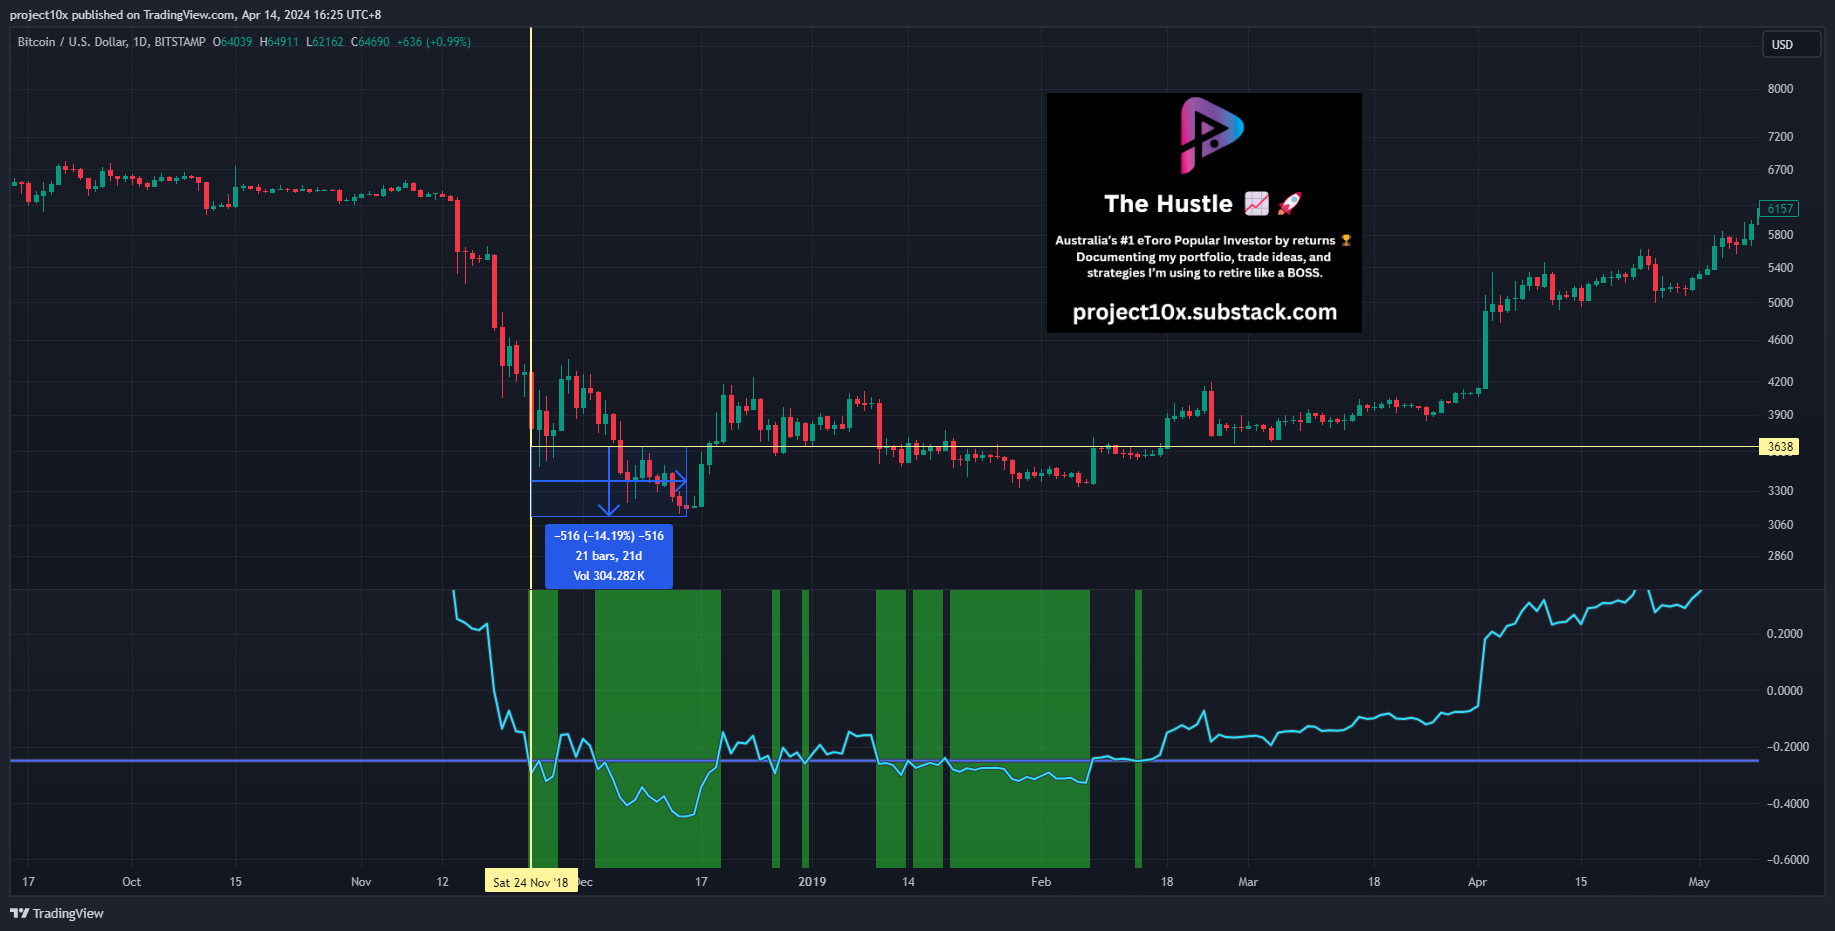
2018
Distance from lowest price: 14%
Duration to lowest price: <3 weeks
Mate. STOP. This is insane. Imagine entering at $3600 and exiting around $60K🔥🔥
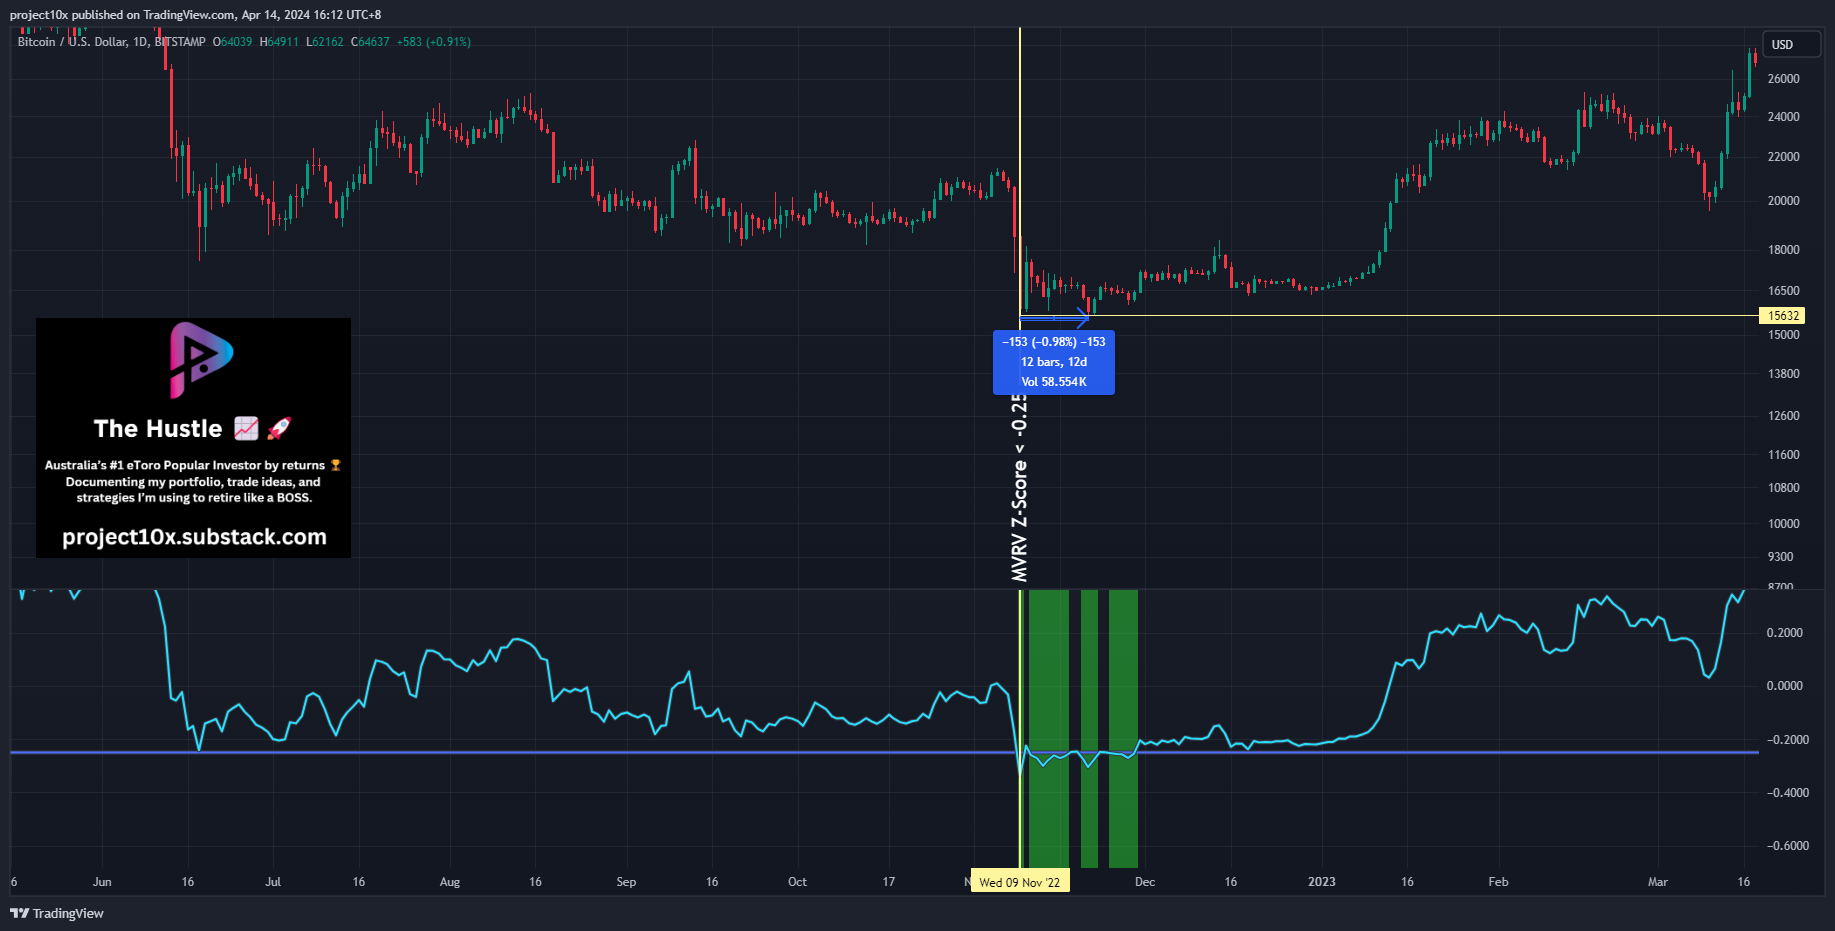
2022
Distance from lowest price: 1%
Duration to lowest price: <2 weeks
I lied. You could get a better entry in 2022. Within 1% of the lowest price and less than 2 weeks off the cycle lows.
WAIT! I know what you’re thinking.
Don’t get too excited. This isn’t going to help you buy the bottom and sell the top. It’s just one indicator.
If you’re going to dismiss my warning then I recommend you at least complete this application form before the end of the next bull run.
")
I’ve given you 27+ indicators for timing the top. Use them all.
Better yet, click that subscribe button and let me do the heavy lifting for you.

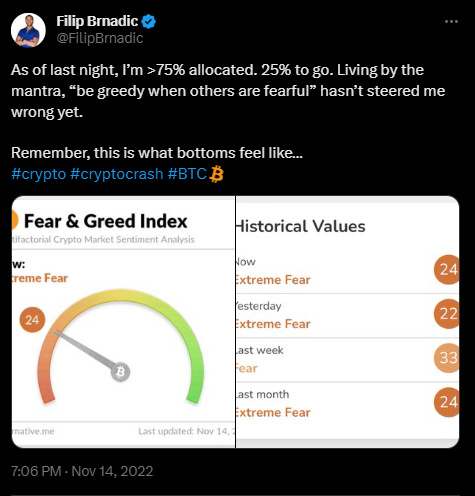
I also have another 30+ indicators to buy the bottom, which is why I was able to allocate 75% of my net worth with confidence at the bottom of the bear market.
But I’ll leave that for the end of the bull run 😉
✌🏽
Filip
The McDonalds application was a nice touch! Lmfao 🤣🤣🤣