
Welcome 👋
Today I’ll switch things up because markets have done nothing but pump for the last 4 weeks, and I’m starting to sound like a broken record.
If you’re new here and want to know why markets are up, check out my previous posts here and here.
As for the rest of us…

𝗜𝗳 𝘆𝗼𝘂'𝗿𝗲 𝘀𝗶𝗰𝗸 𝗼𝗳 𝗹𝗼𝘀𝗶𝗻𝗴 𝗺𝗼𝗻𝗲𝘆 𝗶𝗻 𝘁𝗵𝗲 𝗺𝗮𝗿𝗸𝗲𝘁𝘀 then you should check out last weeks newsletter.
I showed you how I size an opportunity and place my bets. 𝗜'𝘃𝗲 𝗴𝗼𝘁 𝟲 𝗳𝗶𝗴𝘀 𝗿𝗶𝗱𝗶𝗻𝗴 𝗼𝗻 𝘁𝗵𝗶𝘀 𝘁𝗿𝗮𝗱𝗲 𝗮𝗹𝗼𝗻𝗲.
⚠️ DISCLAIMER ⚠️
The content provided by PROJECT 10X PTY LTD (Filip Brnadic) is for educational purposes only and is not financial or investment advice. PROJECT 10X PTY LTD is not a licensed financial adviser under Australian law.
Investing involves risk, including the potential loss of all funds. Seek independent advice before making any financial decisions.
Coming Up This Month
You won’t want to miss the next two newsletters. They be wildin’

Turning a $3800 eToro Portfolio into $1M in 30 years (Issue #2)
“you won’t f****** believe the progress this month”
The Everything Indicator: Liquidity
“once you see it, you can’t unsee it”
The Semaphore 🚦
I’m a macro guy. I zoom out. I look at the big picture. I trade narratives. I’m not here to speculate on something with little to no basis. I have too much at stake to do that.
One of my favourite long-term crypto indicators is what I’ve come to call “The Semaphore”. You won’t find it anywhere - I created it.🦚
It’s basically a semaphore-style pattern that shows the cyclical nature of the crypto market. It shows that crypto experiences:
➡️ 1 x down year
➡️ 1 x side-ways year (after moving up off the lows)
➡️ 2 x up years
To explain what I mean, I will use Bitcoin ($BTC) as my crypto proxy to illustrate the cyclicality of the asset class.
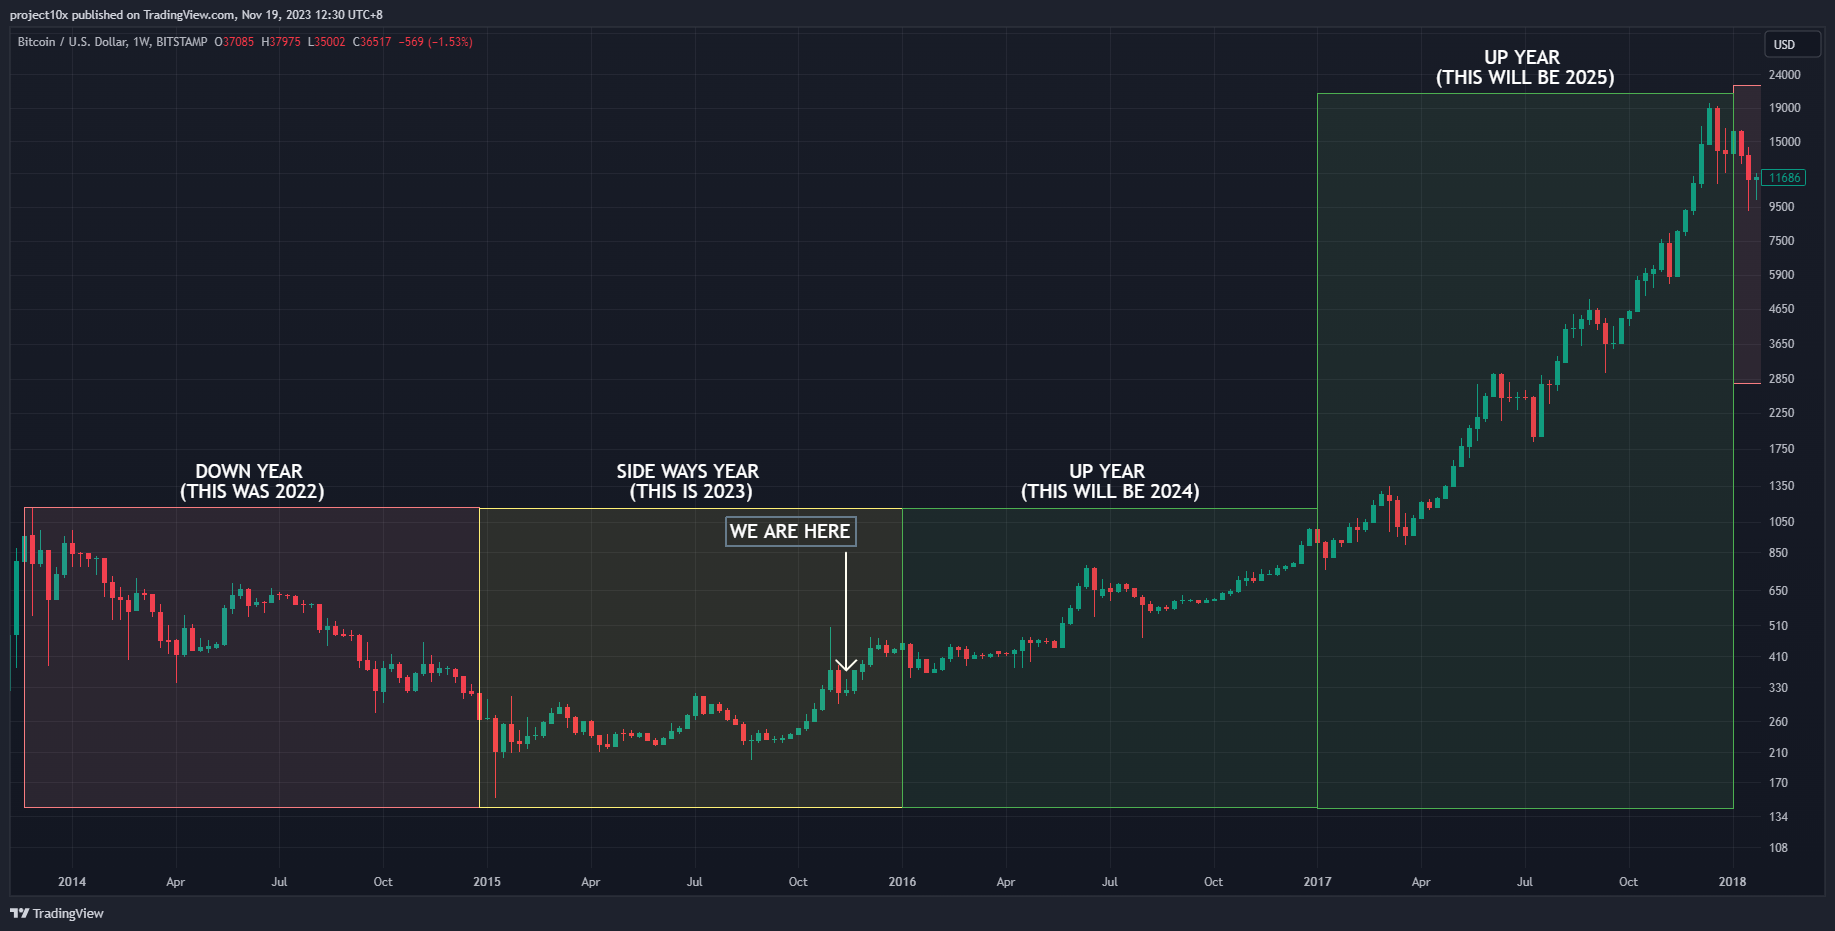
The figure below is one full crypto market cycle from 2014 to 2018 (~4 years). What do you see? 1 down year, followed by 1 side-ways year, followed by 2 up years, right?
I’ve even put a pretty little “we are here” sign to illustrate where we are at in the current cycle.
Let’s look at the next cycle from 2018 to 2021.
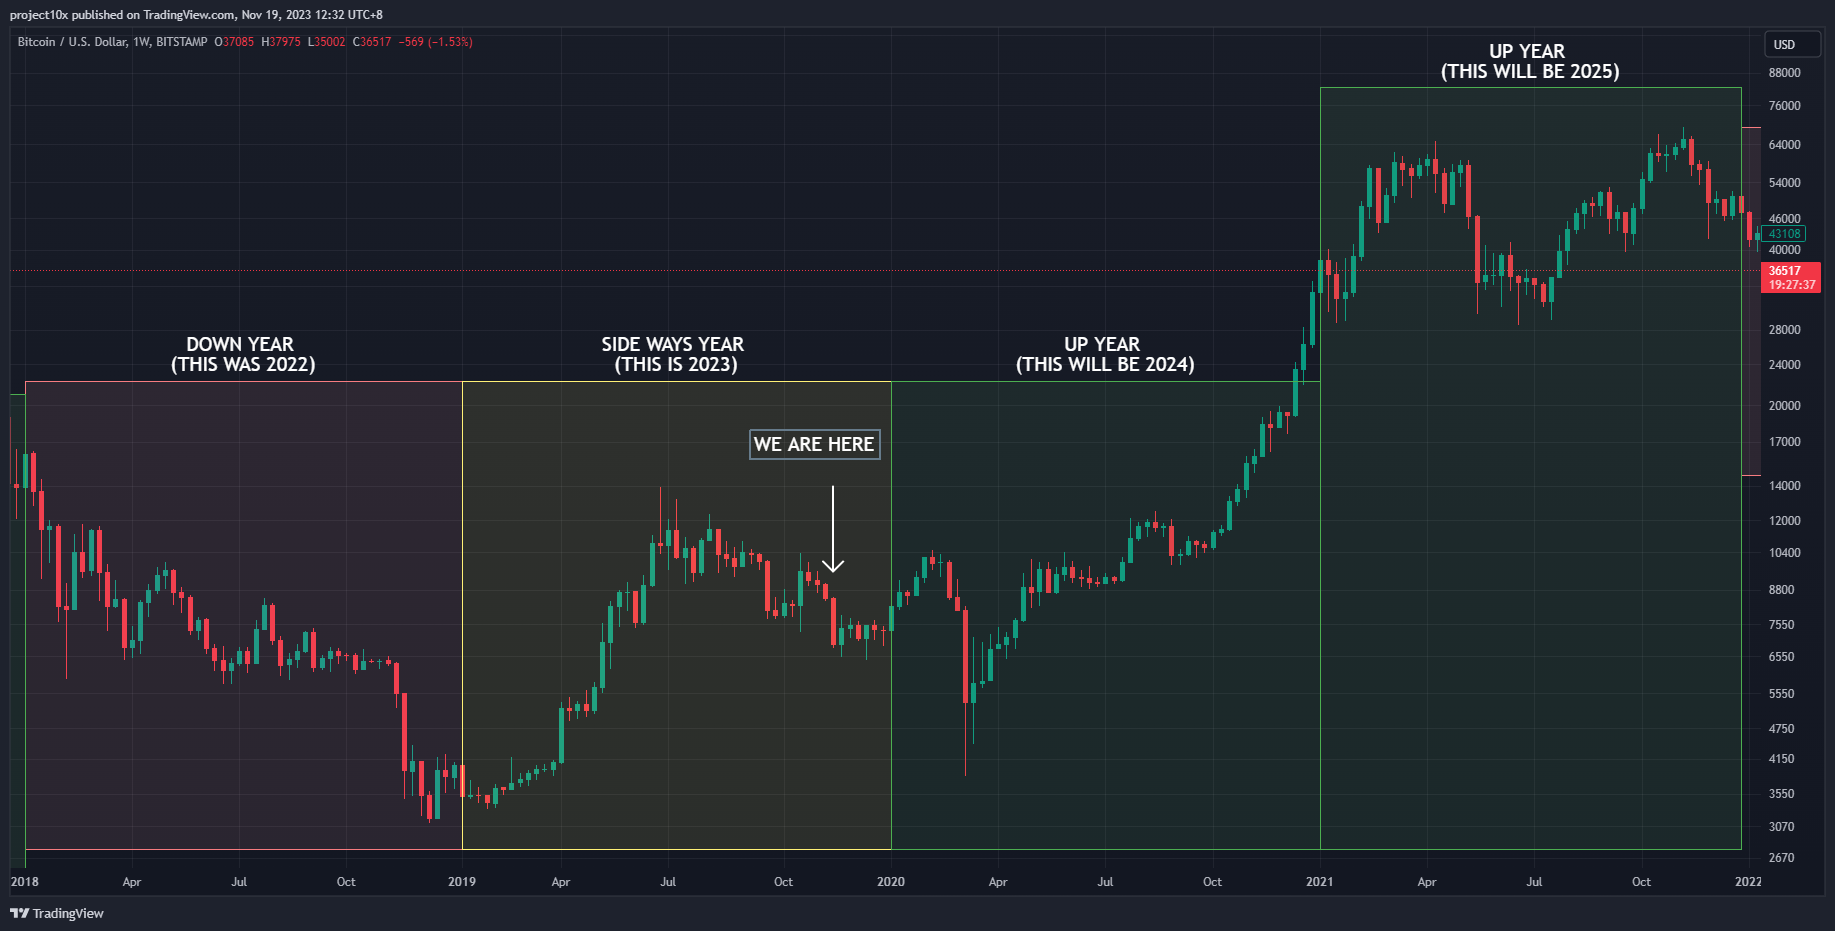
Same story, right?
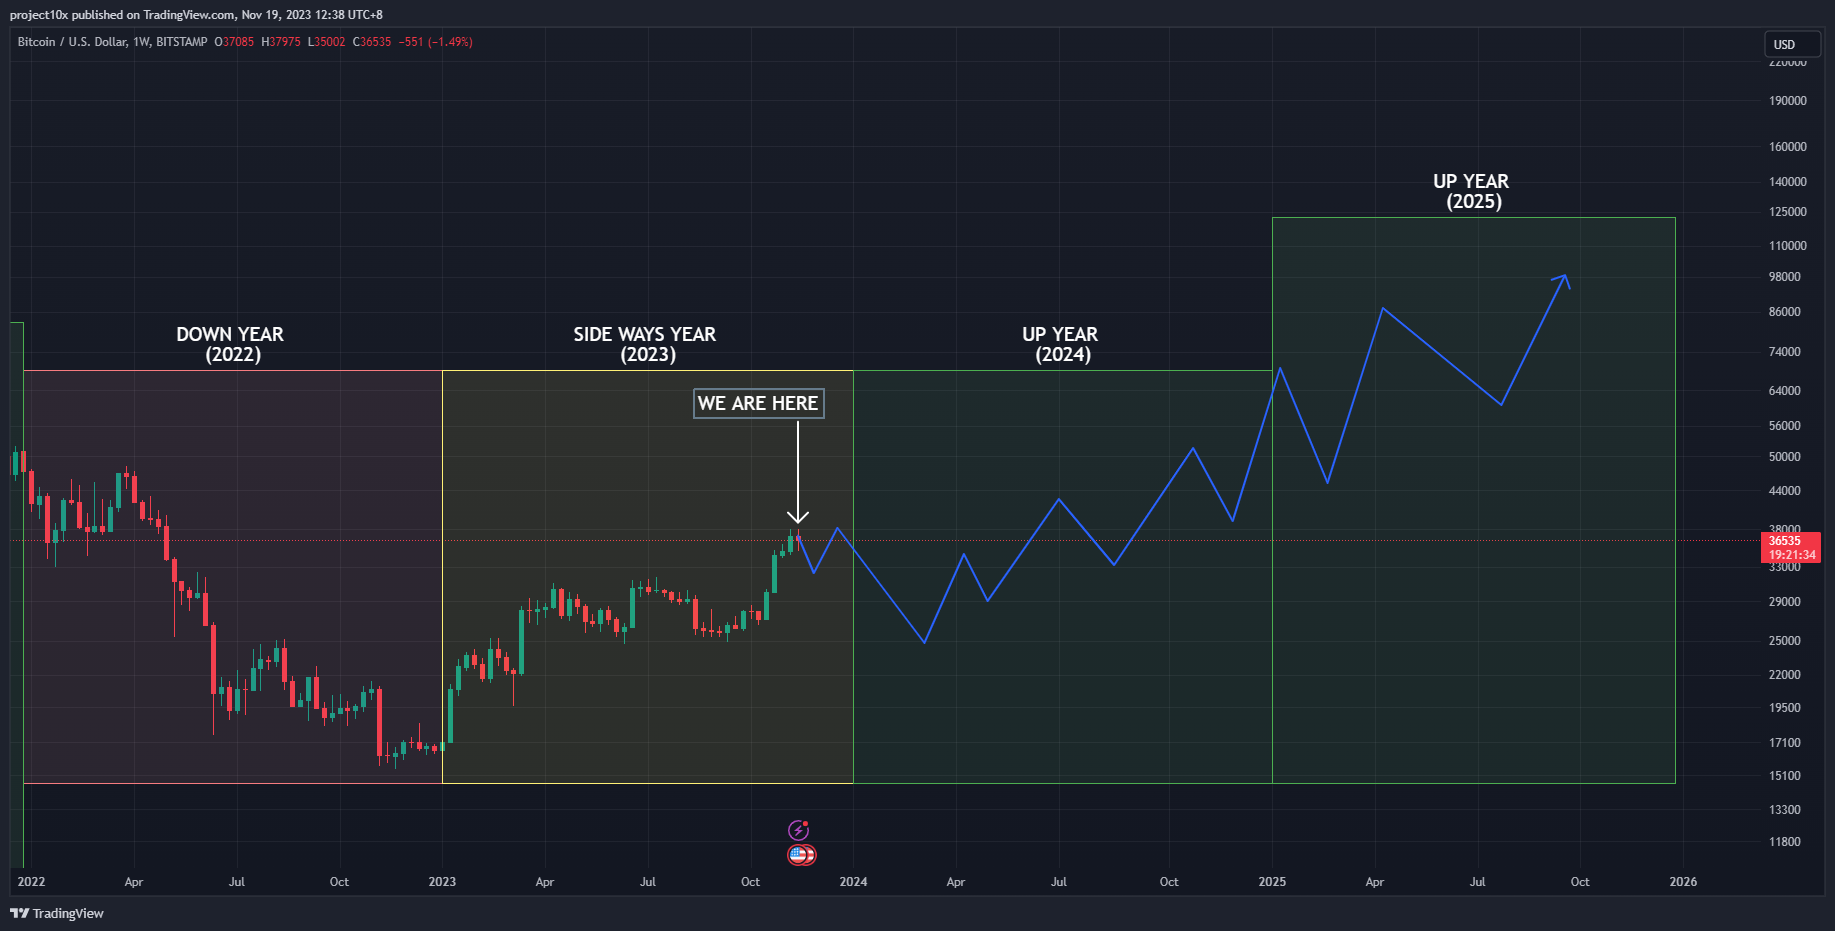
What about this current cycle? Well. That’s been playing out exactly as expected too.
Now do you see why I was buying when everyone was freaking out in November 2022? Does it make sense why I would post something like this in the middle of a bloodbath in markets?
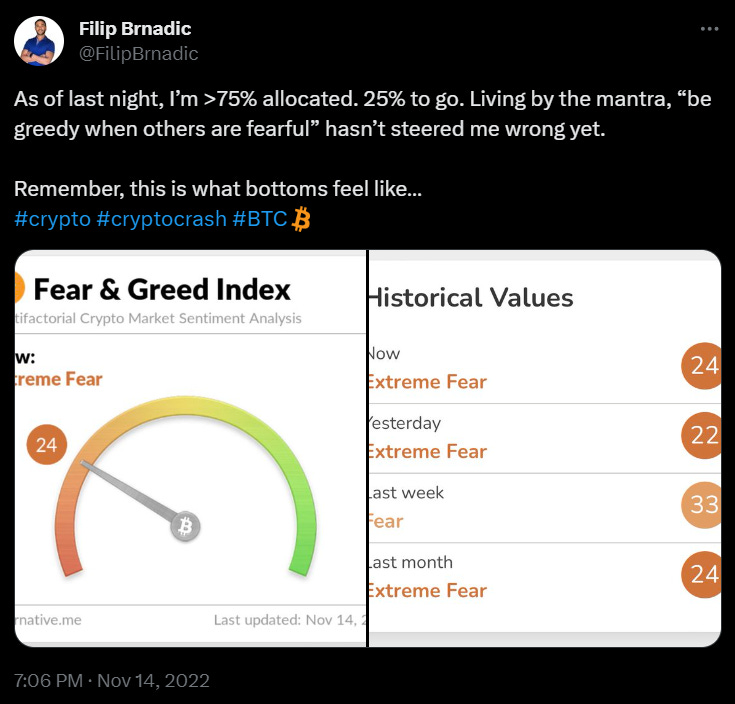
Because my indicators told me to.
Not because I was filled with emotions 🥹
Not because some pleb went on CNBC or some other mainstream media and started talking about a “recession”.

“So WTF are you saying Fil, should we buy BTC?!?!”
No, that’s not what I’m saying.
This indicator tells us that:
Crypto is cyclical - Buy and hold is a good strategy. Buy low, sell high is a better strategy.
The crypto market will peak in the second half of 2025 😉
We can buy at the bottom of the next bear market at the end of 2026.
You might be wondering, “why is it a 4-year cycle?”. “What other indicators are you using as confluence to time cycle tops and bottoms?!?!” “Are there other indicators that show the same thing?”.
Well, for that, my friends, you’ll have to wait until next week when I release my “Liquidity Cycle: The Everything Indicator” newsletter.
If you liked this newsletter and want more indicators to add to your arsenal, then leave a comment below!
eToro Update 🐂
I had 52 people copying my trading strategy on eToro last week. I’m now at 95!
To the newcomers, I say, Welcome to the PROJECT 10X family! Your support means the world to me 🙏
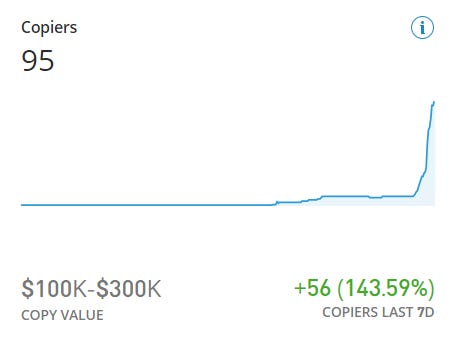
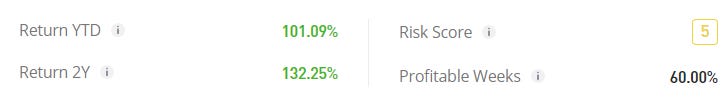
In other huge news, the portfolio hit triple-digit returns Year-to-Date (YTD)!
It may be a little premature, but I’m pretty sure I’m the John Wick of eToro.

Just Kidding!
The moment you start thinking you’re winning, the market has a way of humbling you.
Let’s just stay focused on closing out 2023 with a bang!
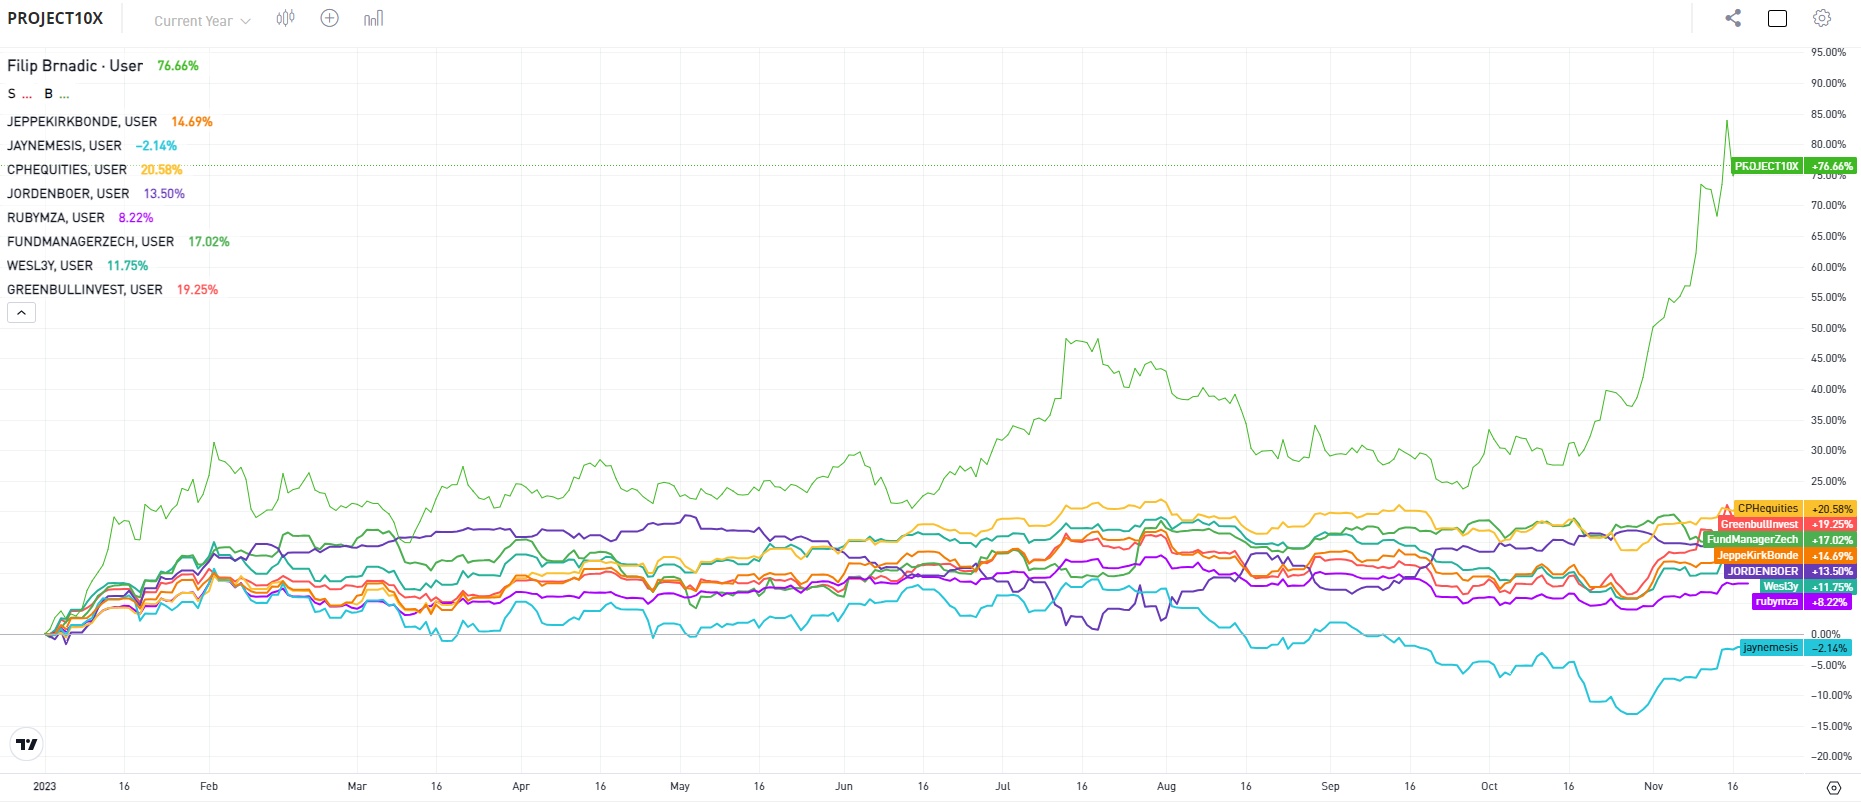
I’ll leave you with the YTD performance of PROJECT 10X against the 7 most popular investors on eToro.
That’s all for now. Catch you next week.
✌️
Filip Brnadic